Entry using chart
Please notice, using chart to enter data, can be done for the main version only. For example for the budget main version.
On entry, made a chart of the desired row. Chart can be made either by double-clicking the account’s row text. Alternatively, mark the row -click the row text, and press chart -icon.
If the selected row contains data in other time periods already (actual, forecast), they will be shown in graph for comparison.
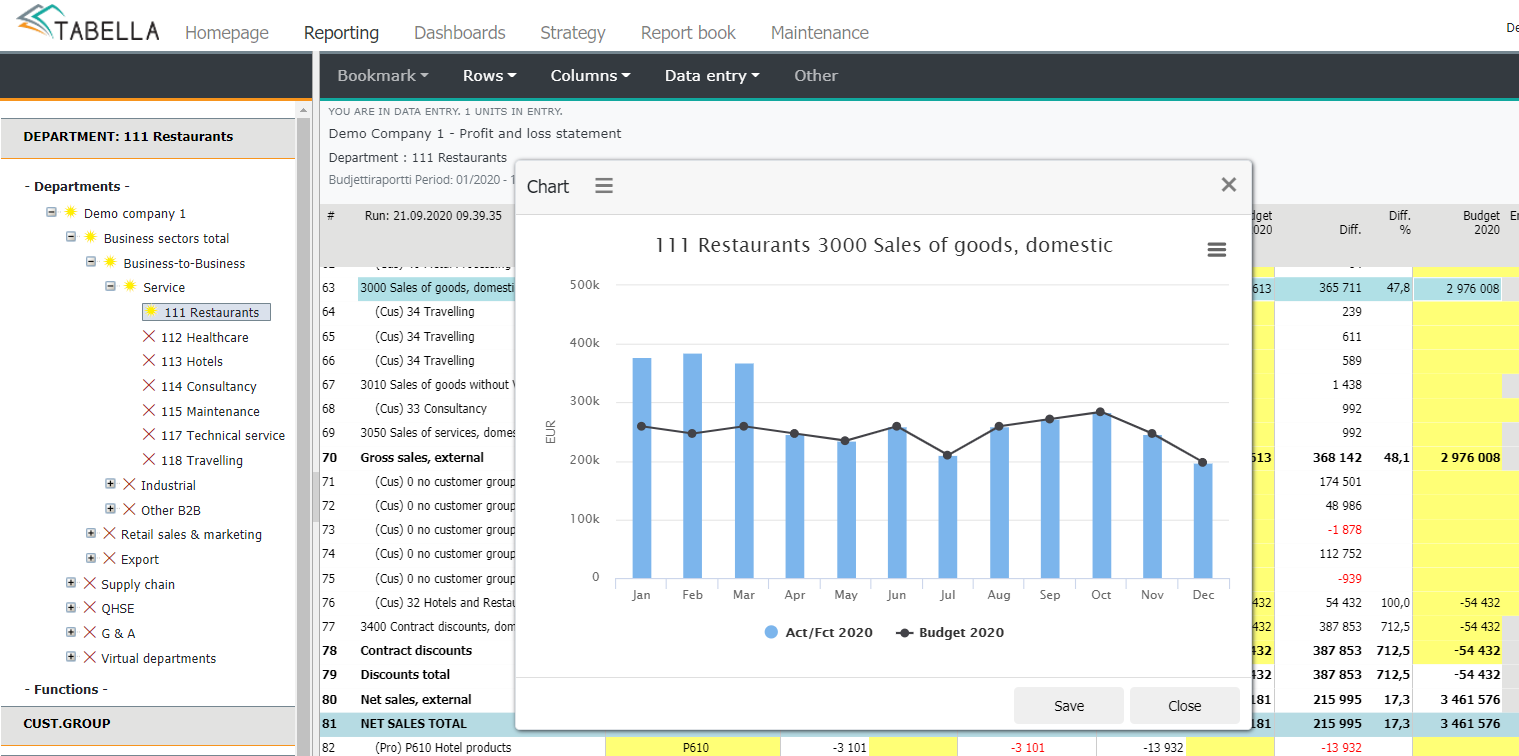
In the example, the line is budget’s main version data. The idea is to use mouse to drag the line’s “knots”, to change the value for the respective month. When the cursor is placed over the “knot”, month’s precise value is displayed.
Accept entry, by hitting chart’s Save button.
Note
If the row is empty, enter data manually first, at least for one month, after which chart can be used.