Dashboards
Dashboard area contains all dashboards a user has saved. Each dashboard consists of charts saved from the reports. The number of Dashboards is limited to eight (8). Dashboards are updated during Scheduled report run, run normally at night.
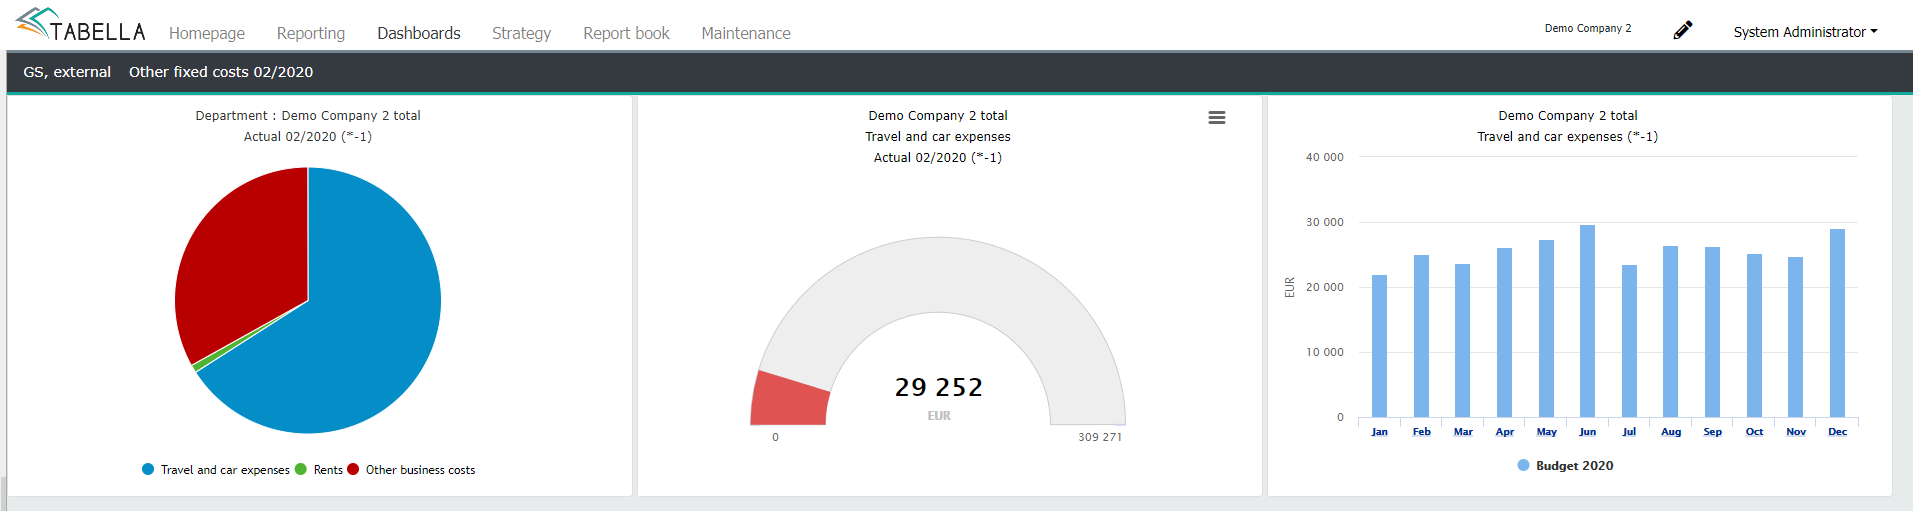
Browsing Dashboards
Move on to Dashboard area. See the example below - the dashboard contains three saved charts.
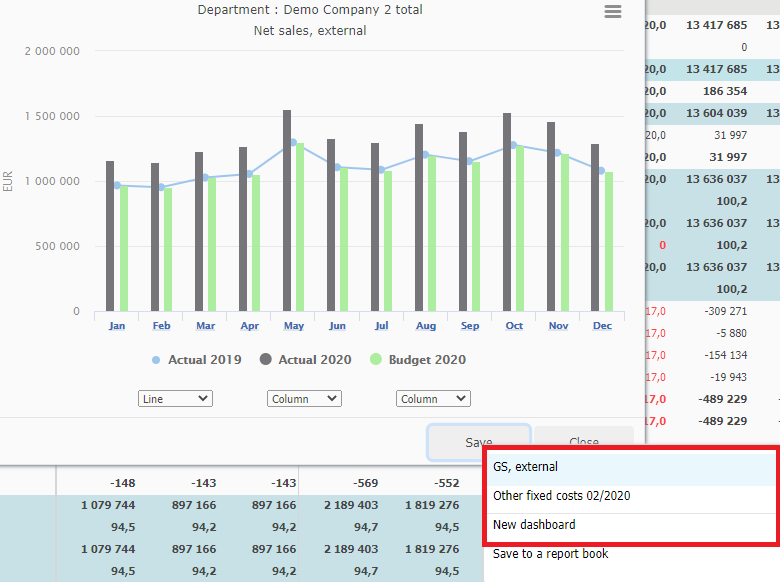
Saving chart to Dashboard
Make a chart and save it to Dashboard by pressing Save. If no dashboard has been saved yet, choose New dashboard. Alternatively, choose existing Dashboard from the list, to save the chart to.
Note
Please notice, only basic chart can be saved to the dashboard. If not, the option Save is disabled.
Dashboard maintenance
In Dasboard, use right mouse on saved chart, for example, to change the used comparison period’s value. use the same menu to reset the entered value. The default value used is current year’s budget total.
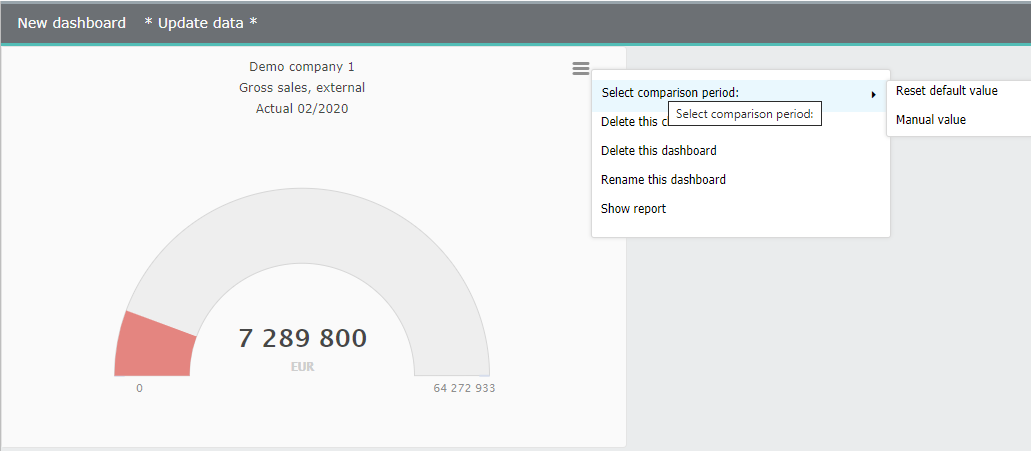
- Choose the comparison period
Change the comparison period (only for the gauge type chart).
- Delete graph
To remove a chart from dashboard, choose “Delete this chart”. Please notice, if the chart to be deleted is the only one, also the dashboard is deleted.
- Delete this dashboard
The whole dashboard with its content, is deleted.
- Rename this dashboard
Change the dashboard’s name.
- Show the report
To open the report, which the chart is saved from.
Inside dashboard, change chart’s place by clicking it, and dragging to new location.