Add a new column
Note
New columns are added to the analysis report’s columns only
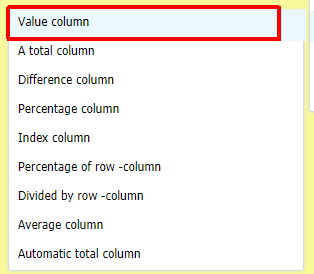
Add a new column:
Value column
Value column is imported / entered, or actual value. Other columns, for example total -, difference columns are calculated columns.
Select desired location in the column set, and right click column header. Add new column to the left / right.
Choose columns type: Value column
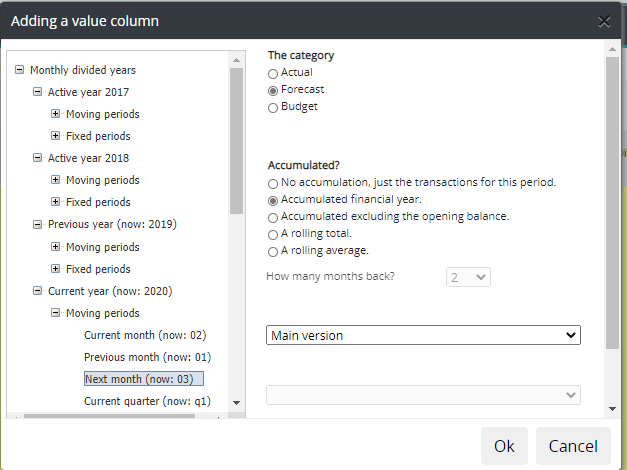
Time periods
Time periods are divided into two parts. Monthly divided years and whole column groups, e.g. LRP years.
Years divided into months
Define column’s monthly time period: previous year / current year and next year.
Moving or fixed periods
Years have been divided into two parts: moving and fixed periods. Moving period will change when the system period is changed. For example, when reporting month is changed forward. Fixed period will not change, when reporting month is changed. However, a year change will affect fixed period also.
Whole column groups
Whole column groups consists of: Long Range Plan (LRP) and Rolling column groups. The LRP years shown, depends the defined LRP length. It is possible to select all LRP years, or until selected LRP year. Rolling column groups are column sets, defined for rolling forecast -for example by quarters. How to make rolling columns, see chapter Rolling column models.
Category
Afer the time period is selected, choose the category column uses: Actual, Forecast (Order backlog) or Budget.
Note
The selected time period determines whether category selection is available. For example, if LRP years are selected, the category selection is disabled.
**Order backlog -is tailor made feature, and is not part of this manual.
Accumulation
Define accumulation rule.
No accumulation, just the transactions for this period -transactions only for the chosen period is shown.
Accumulated financial year -accumulated data for the period, from the beginning of the financial year.
Accumulated excluding the opening balance -accumulated from the beginning of the year, without opening balance.
Rolling total -summed transactions, of the defined months backwards*.
Rolling average -average of the defined months backwards are shown*.
How many months back? -choose the months if rolling total rolling average is selected.
Version
If the selected category has versions defined, choose desired version from the drop down menu.
Number content
Number content is a special function, which is not in use in the standard system.
Add column to column model
Once the selections have been made, press OK, and define column’s header. The summary of the column is shown in the window.
If the column with same definitions exists already, a message is displayed.
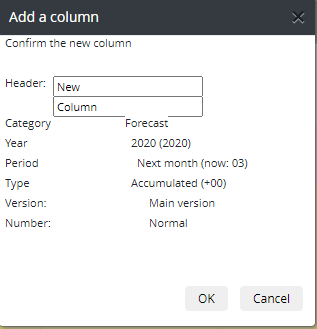
Connect the column to the existing column model, or create a new model and connect model into it.
The column calculation tables
If there is a need to calculate a value for a column, based on other columns in several steps, such a column is defined on the Column calculation tab.
To add a column, right click row text, and choose Add New column. Specify column headers. Select the columns (Equals and Argument) from the list with the right mouse button, and specify the calculation rule between them. For example, of the two difference columns, the index column is calculated. If necessary, specify an additional calculation using the Calc2 column.
The column created, is added to the Analysis tab. Connect the column into the column model. The model has to include also the columns defined in the Column calculation tab.
Note
If the column with same defitions exists already, a message is displayed.
Total-, difference-, percentage, index -column
When defining total, difference, percentage or index column, first define the columns between which, the sum is calculated, for example.
Choose two columns: Column 1 and Column 2. The calculation is made as follows:
Calculation rules
Index = (Column1 / Column2) * 100
Percentage = ((Column1 - Column2) / Column2) * 100
Difference = Column1 - Column2
Total = Column1 + Column2
When ready, define column header.
Connect column to the column model
Save changes, by pressing Save-button
Percentage of a row column
Percentage of a row column is explained in its own chapter.
Divided by row
Choose desired chart of accounts, if several are in use.
The ratio is obtained by dividing column with a row
Choose column and then row. More information about variables, can be found by pressing Variables button.
For example, Cy = current year, By = budget year Ly = last year Cm = current month.
Note
the column model has to include the column, from where the division is being done.
Average column
Calculates the average of the two periods
Automatic total column
The automatic total column menu contains predefined total columns. The list contains the main versions of the selected time period only. For example, the automatic column Budget, is a column, that contains all main version’s of the budget. In a report, the total column is one column that can be opened, like a normal sum column: right-click on a column header and select Open
To exit from the maintenance, choose Back | Yes. Write a short comment about the changes made. The comment is displayed at Maintenance | Other | Log.
In report browsing, choose the column model: Columns | Column models for Analysis report | “Column model”.
Note
New columns are being calculated during the report run. If column has no data, run reports. See report run.