Introducing Tabella’s user interface
Tabella is used with a web browser, and does not require any additional applications. Basically, any modern web browser can be used, but the following are officially supported: Microsoft Edge, Google Chrome, Mozilla Firefox, Apple Safari.
Note
Tabella utilizes JavaScript and cookies, so the browser must allow these, in order to Tabella would work correctly. Generally, by default, web browsers allow these.
User interface
Tabella’s user interface consists of different areas: Homepage, Reporting, Dashboard, Strategy, Report Book and Maintenance.
Below is a picture of the Reporting area. Interface’s different parts are numbered.
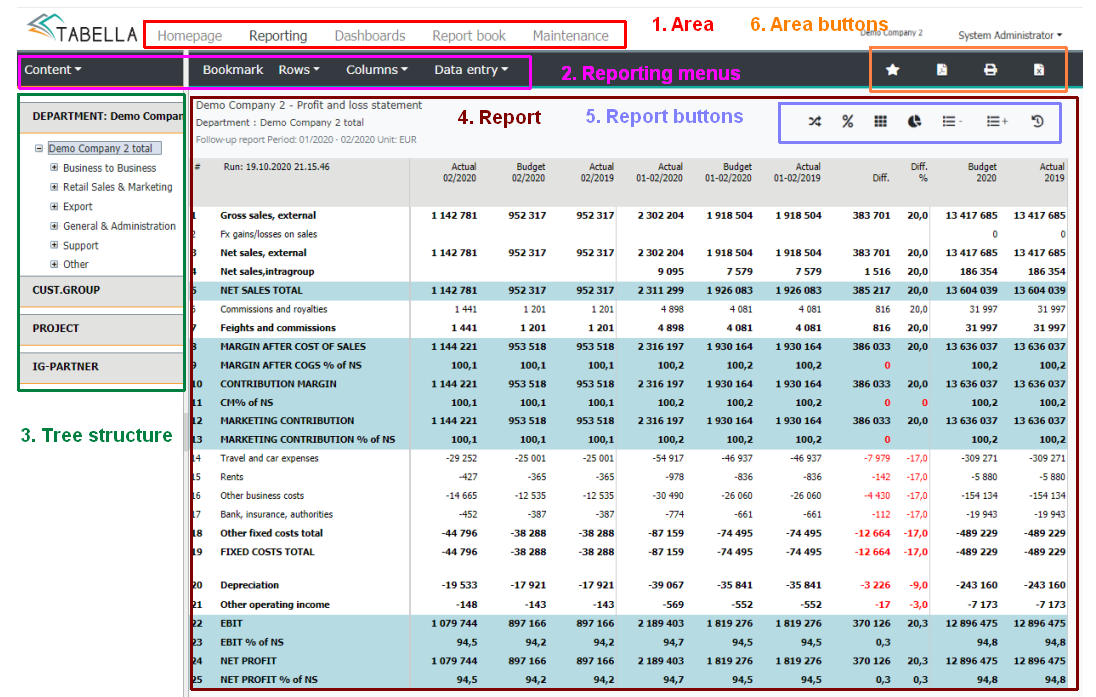
Area
Reporting menu
Tree structure
Report
Reporting buttons
Area’s buttons
General buttons
Button descriptions
General buttons
Button |
Name |
Description |
|---|---|---|
Report’s comments |
Browse and comment on reports |
|
Bookmark |
Bookmark management |
|
PDF print |
Downloads background report in PDF file |
|
Report printing |
Print the report |
|
Excel print |
Downloads background report in Excel file |
Reporting buttons
Button |
Name |
Description |
|---|---|---|
Temporary period change |
The user is able to browse the reports for the selected period |
|
Percentage report |
Changes report to %, in relation to the selected row |
|
Row- and column report |
Make row- and column reports |
|
Graphics |
Make charts of the chosen area |
|
+ |
Long |
All account and sum rows are displayed in the report |
- |
Short |
Sum rows, without account rows, are displayed in the report |
Restore |
Return to the previous stage |