Create a new special report
Special report in report browsing:
Short- and Long report buttons are not in use
Row model can not be changed
Drill-down is not in use
Lack of these functions is due to the static nature of the rows; everything is already defined, each row is custom made, and all levels of accounts and the organization are fixed.
Special report can be saved to the Report Book. Report Book is add-on, thus it is not in use in all installations.
Special report user rights have to be given for end users. See chapter Maintenance | Users.
Purpose
System Admin maintains special reports. Report allows to combine desired cost centers (-groups), companies and accounts, to form report’s rows. Additionally, it is possible to define internal calculation rules for the report. Special report can be saved in to the Report book add-on, if in use.
Special report has more versatile and flexible row features than rows in normal report.
Normal report row = an account, account group, of the organizational level chosen in the tree structure.
Special report row = combination of the selected company (companies), cost center (cost center group’s) and account (account group) or a figure produced from these by calculation.
Special report maintenance
Special reports locate in the Trees part. Move on to maintain reports by choosing Special reports
Create new Special report
List tab contains all special reports define, if any.
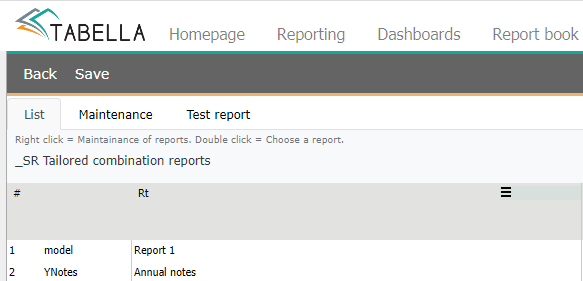
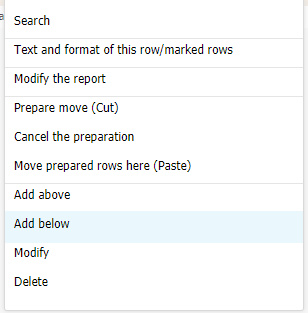
Add a new special report. Right click the row text, and select Add below / above.
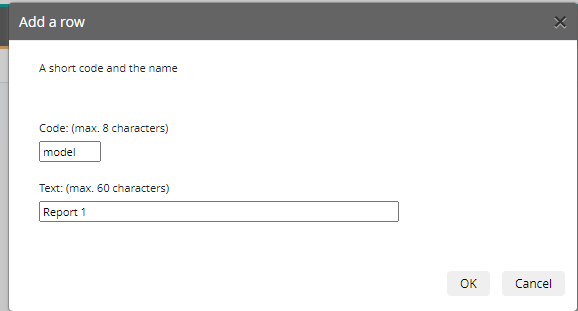
Define a code and a name for the special report. From the next menu choose either empty base, or copy existing special report as base.
Note
The code name must start with letter. It is not allowed to start row with a number.
Do not use any special signs in the code, for example: ? / & % ¤ # ” or space(bar).
Move on to maintenance. Right click report’s row text, and choose Modify the report.
The maintenance and Test report tab is opened.
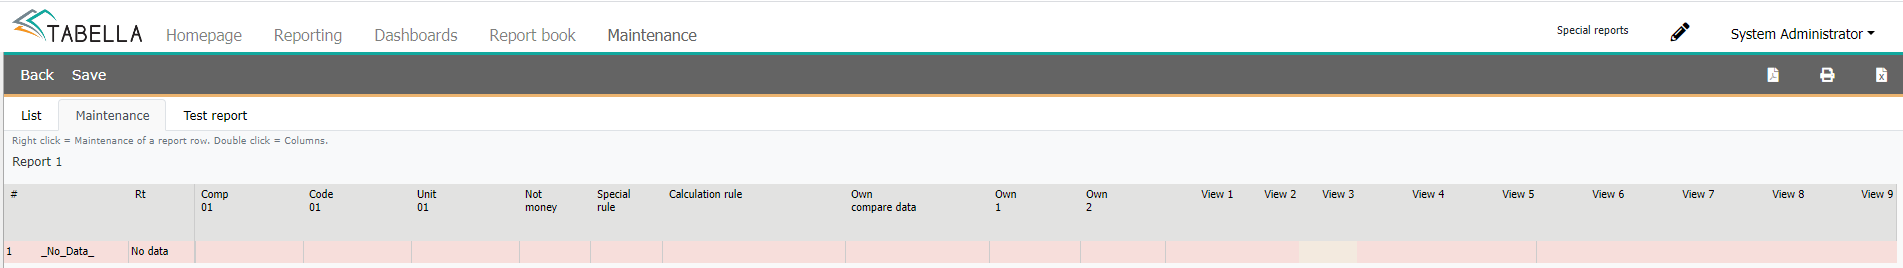
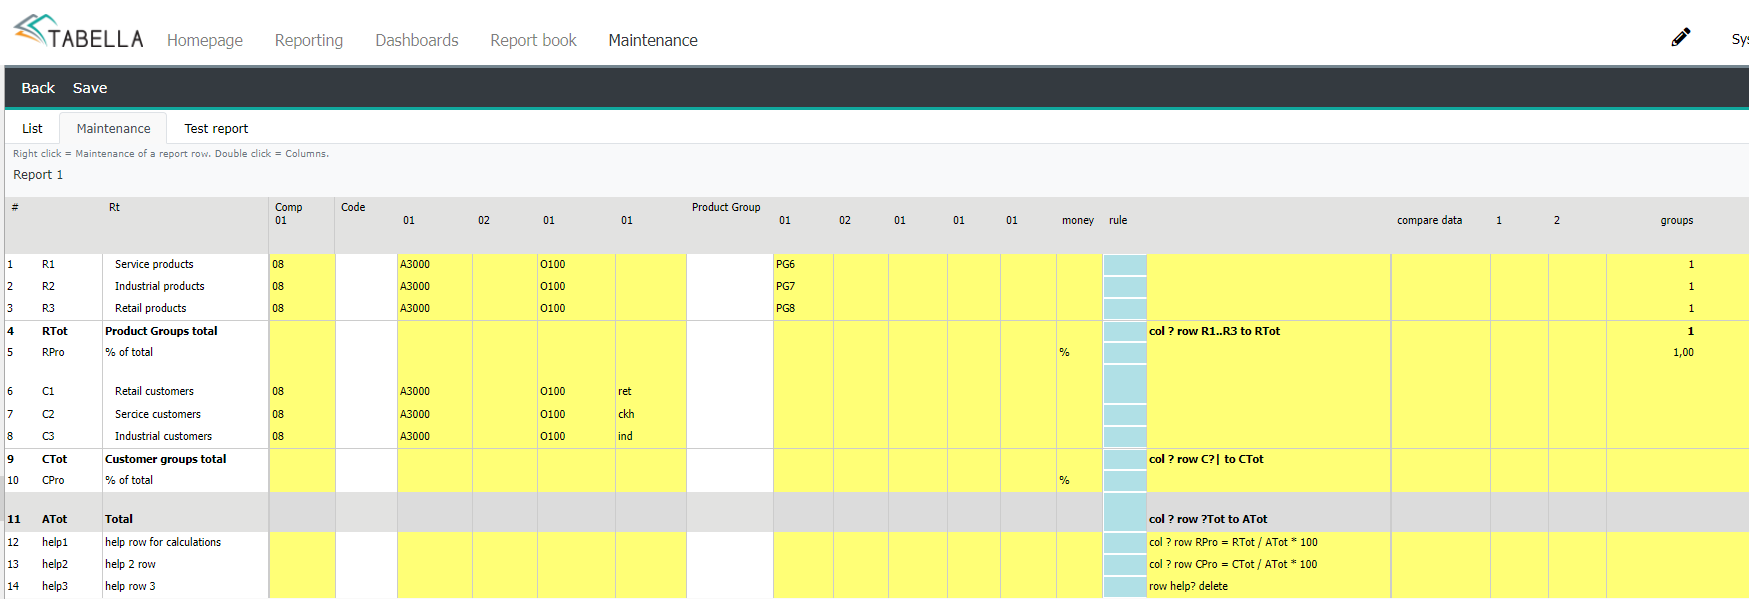
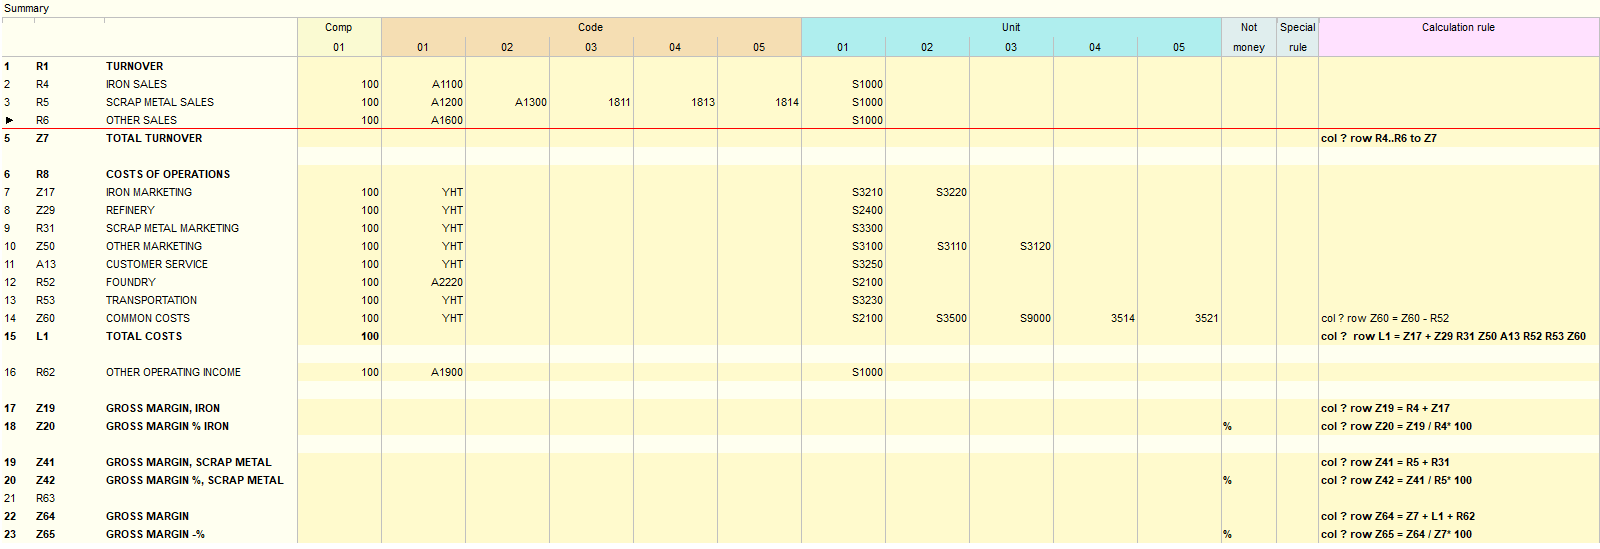
To add the first row for the special report, right click row text, and choose Add Below. Define a code and a text for the row. The entry area (yellow) is opened.
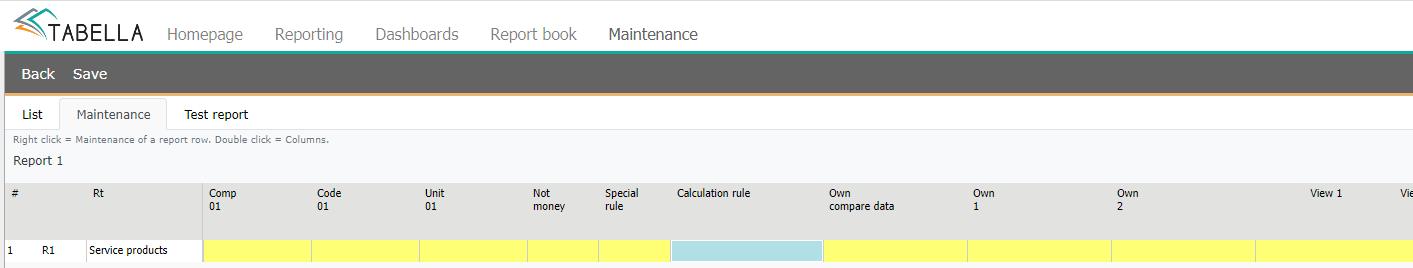
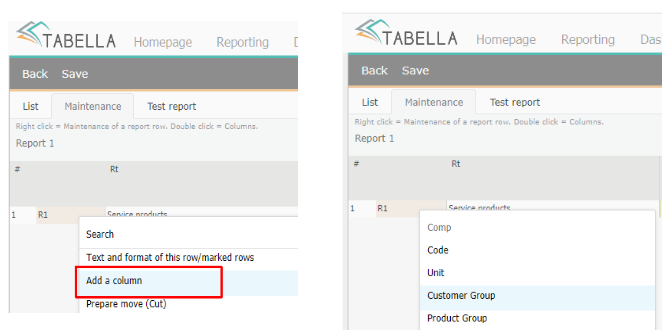
By utilizing columns, the row’s content is defined. The first three columns are mandatory: company, account, cost center. Additional dimensions can be added to the column set, by right clicking row text, and choosing Add column. Desired dimensions are selected from the list. The columns following dimensions: Not money, define if the row’s value is not money. Special rule, define rule for the value, for example accumulation, if needed. Calculation rule, column contains the actual calculation rules for the row.
The definitions to the columns are made by using right mouse menu:
Note
Company, Account and Cost center are mandatory choices
Comp = select the company which data is fetched to the row.
Account = select account / group of accounts code -alternative ways to make the selection.
Cost center = select chosen company’s cost center / group of cost centers’ code, which data is fetched to the row.
Dimensions = select dimensions, for example project.
NotMoney = define, if the row’s value is not money.
Note
Percentage calculation. Rows whose “Not money” column value is % (percentage), are being calculated after the report is being loaded, in order to ensure the correctness of the numbers.
Special rule = define special rule for the value. For example, NoAcc, if the value is not allowed to be accumulated.
Calculation rules = internal calculation rules for the special report.
By default the entry base consists of one column for each entity. I.e. one column for account, cost center, for example. To add more columns for each, right click the row text. Choose Add column and select additional Account column, for instance.
In case, added columns are used, values of each column are added up. For example, if there are several account columns, then all accounts’ values are added up for the row. Two cost center columns’ row value is their sum, etc.
Add needed rows to the report, and define the data to be fetched, by using columns. The number of rows is not limited.
The calculation rules for the row, are entered to the corresponding column, by using Tabella’s basic internal commands.
Example 1
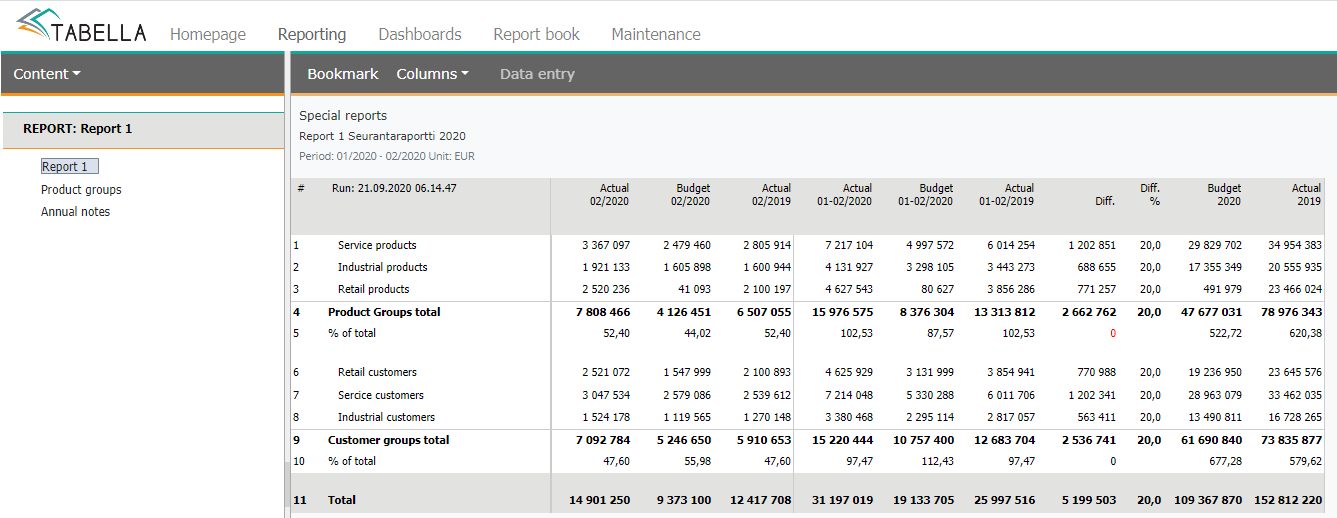
The example report in brwosing: Content | Other reports | “Special report”
Calculation rule examples:
The rows are identified by their row code, entered when adding the rows. The calculation rule is entered to the row, whose value is calculated.
leave empty space between commands. For example col ?. The space is not used (..) -definition. For example R3..R9
command col or row begins the command line.
Command |
Explanation |
|---|---|
col |
Column |
row |
Row, for example, row R4 refers to row with code R4 |
? |
Activates all. For example command col ? activates all columns |
x..y |
Adds up all from the x to y, where x or y is either row- or column codes. For example, command R4..R6 to R7, adds up rows R4-R6 to R7. |
- |
Subtracts |
+ |
Adds up |
/ |
Divide |
Multiplies |
|
= |
Equals |
x to y |
Adds up all from the x to y, where x or y is either row- or column codes. For example, command R4..R6 to R7, adds up rows R4-R6 to R7. |
delete |
Delete |
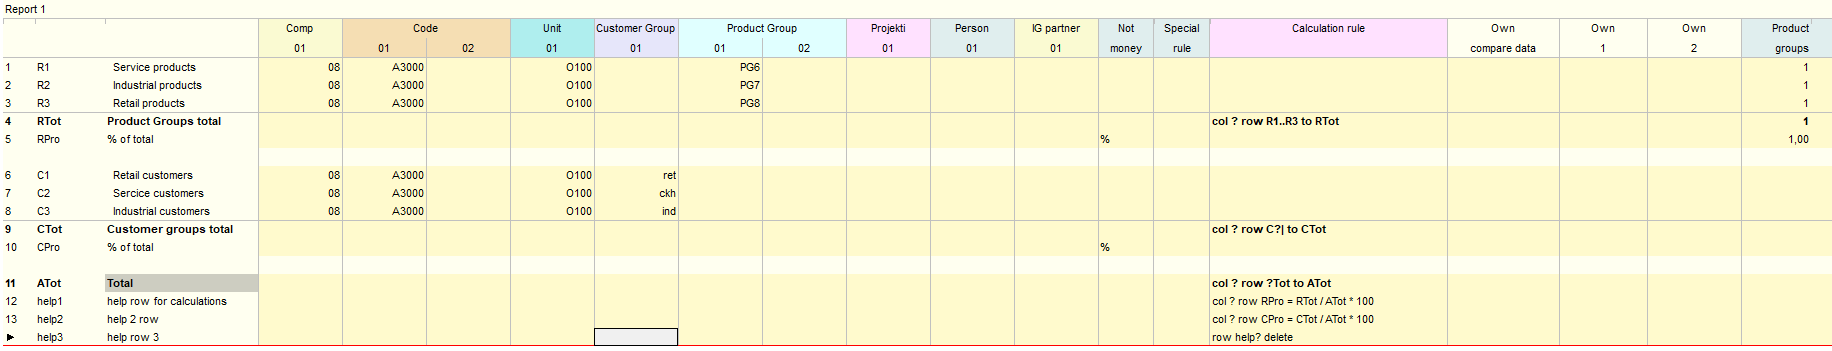
Example 2, using HELP-row
In the example the HELP-rows are used with percentage calculations. The rows are being calculated after the report is being loaded, to ensure that numbers are correct. Finally the Help rows are deleted.
In the example: col ? row C?| to CTot, all rows beginning with C, and are two character long, are being moved to CTot.
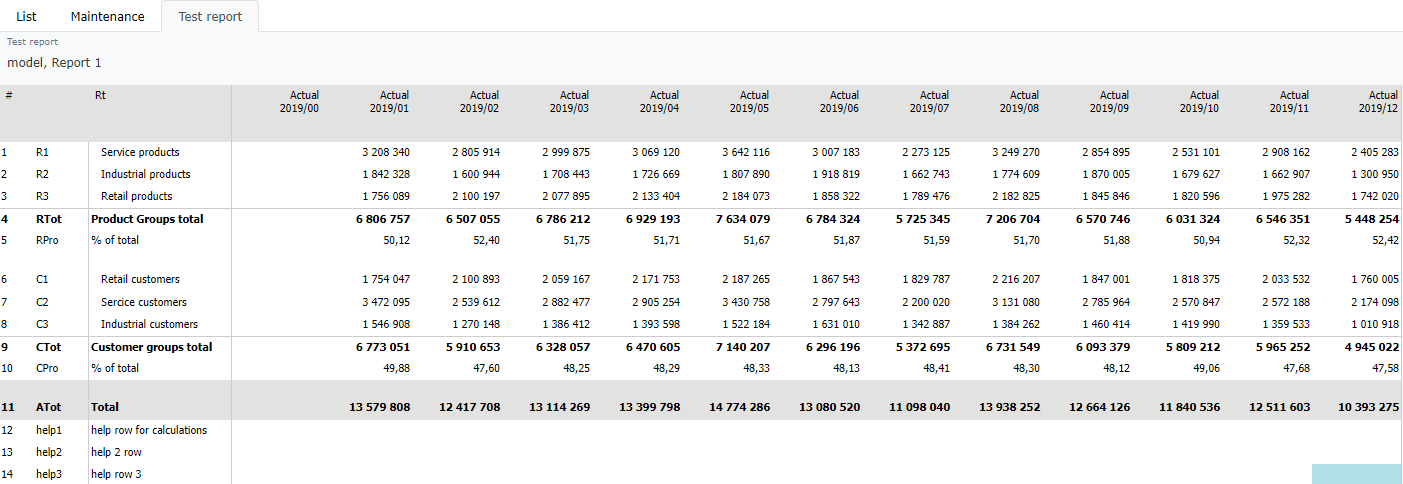
Test report tab loads test report with current definitions.
Example 3, Delete command and temporary help row (APU)
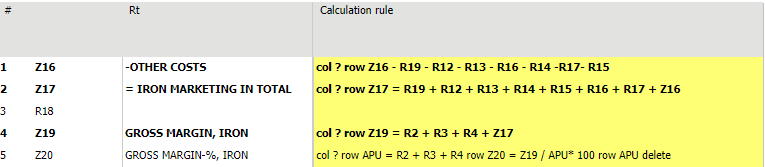
“Round 1: (col ?) all columns.
Round 2: (row APU = R2 + R3 + R4) creates temporary row APU, which sum of the rows R2, R3 ja R4.
Round 3: (row Z20 = Z19 / APU * 100) Row Z20, (calculated row), consist of the row Z19 divided by the value of APU row (=R2 + R3 + R4) and multiplied by 100. Result is %-value.
Round 4: (row APU delete) delete APU row.
Note
When using row- / column activation with ?, remember to use space between commands. For example, col ?.
Test report. After the necessary specifications for the report are being made, it useful to run test report by choosing it. The report shows the report with current definitions and can be used to check that numbers are what they suppose to be.
When the special report is finished, exit the maintenance and save the changes made.
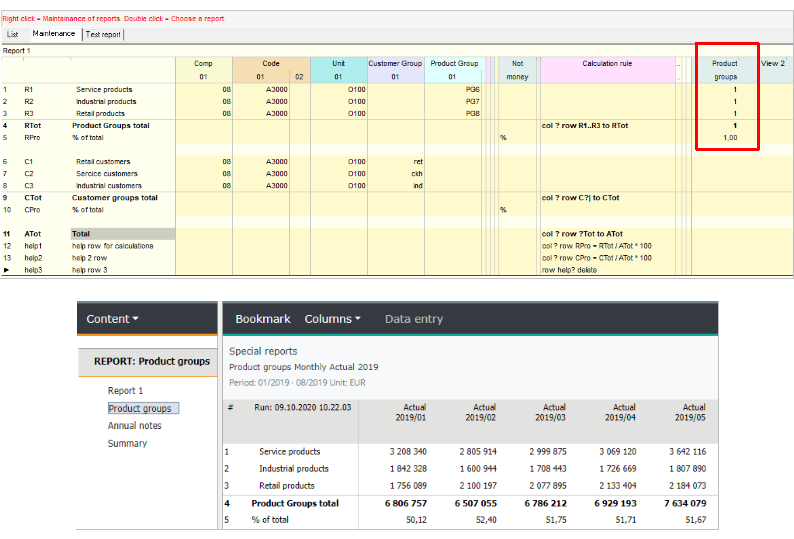
Special report’s View
It is possible to make a View from the special report, in the same way as for the row model (Chart of accounts maintenanace).
To make a view from a special report, right click an empty view column header. Define view’s name and hit OK. Next, put marking “1” to the rows you want to included to the View. Save changes. When exiting maintenance, choose Back | “Save changes”.
Defined View is a separate report, shown in Special report browsing.
To delete a View in the maintenace, remove “1” markings from it, and save changes.
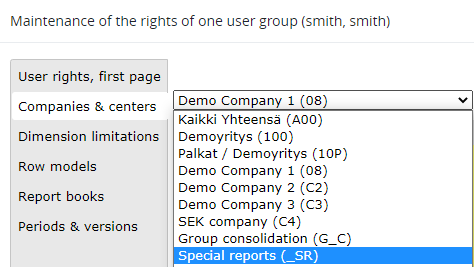
User rights for special reports
User has to have rights to browse the special reports. Explained in more detail, in the chapter User rights; user rights for companies and centers.
Note
If the structure of the special report is changed, please remember to check and save user rights.
Special report browsing
To browse ready-made special reports in the Reporting area , choose Content | Special reports
Special report tree consist of all special reports System Admin has defined. To browse report just select it from the tree. It possible to change column model for the special report, either analysis columns or monthly columns. Additionally other Columns selection can be utilized.
Note
Short- and Long report buttons are not in use
Row model selection is disabled
It is not possible to drill down
The cost center browsing is limited, due to the static nature of the special report rows -everything is already predefined: the company and cost center is already predefined for each row.
Special report can be save to the Report book