Tree structure

Tree structure is located in the left frame, and is always available in the Homepage and Reporting area. It includes all the specified dimensions.The number of dimensions depends on the accuracy of reporting and planning required.
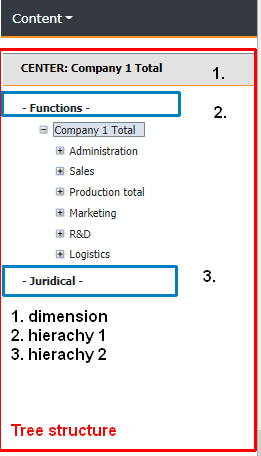
In the example, Dimension CENTER -company’s cost centers is in use. Dimension can include several different hierarchies. Using hierarchies allow dimensions’ (e.g. department) different arrangements. In the example, tree structure has two different hierarchies: 1. by Functions, and 2. Juridical. For example, hierarchies can be created to reflect organization’s different years’ structure: 1. Hierarchy: Organization 2020 and 2. Hierarchy: New organization 2021.
The tree structure of a single dimension can be defined as multi-level. The levels of a tree structure are called sum levels. In the example, sum levels include ” Company 1 total “, ” Administration “, ” Sales , etc. All cost centers in the 1st hierarchy are included in ” Company 1 total , at the sum level.
Use of tree structure
The purpose of a tree structure in reporting, is to limit shown data, according to the choices made. I.e. when the user selects tree stucture level, the report shown will contain data from the selected level only. For instance, If the user selects level Administration, the report will contain data from the Administration’s cost centers only.
It is therefore good for the user to understand, that the choices made in the tree structure, affect data displayed in the report. The data displayed is in real-time, therefore it makes it easy to follow up different departments or activities.
Tree structures right mouse menu functions are explained next.