Columns
Column models can be found in Reporting area’s Columns menu. Each model contains columns the System Admin has defined for it. That is time periods, accumulated totals, difference - and index columns. System Admin defines column models in use in the Maintenance area: Columns.
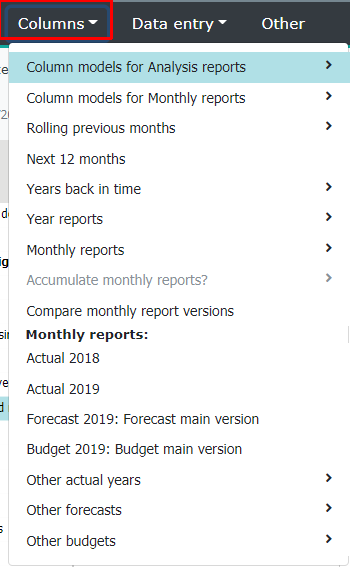
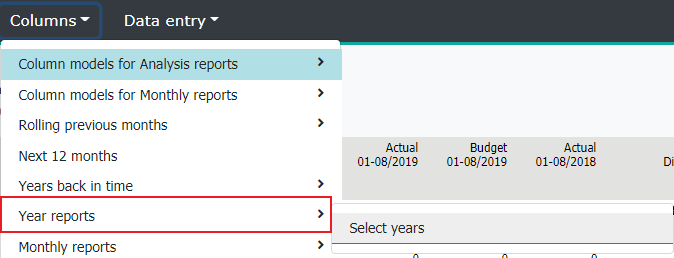
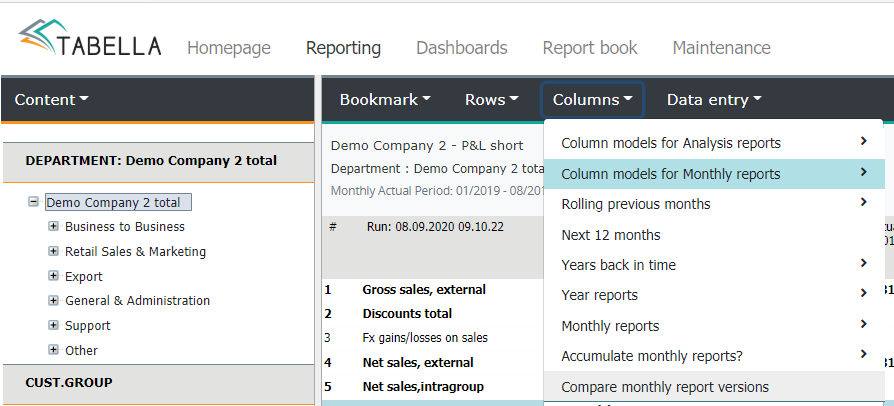
Choose desired column model from the Columns-menu. Models has been divided in two separate group: Column models for Analysis reports and Column models for Monthly reports. In addition to column models defined by the System Admin, there are several ready made column models available, explained in more detail below.
Next, the content of the column models is explained.
Column models for Analysis reports
The analysis reports have a different selection of columns than the monthly reports: Normally including for example, actual data, budget data and various diffrence columns. The System Admin can define additional models for the analysis reports, which the users can choose at any time.
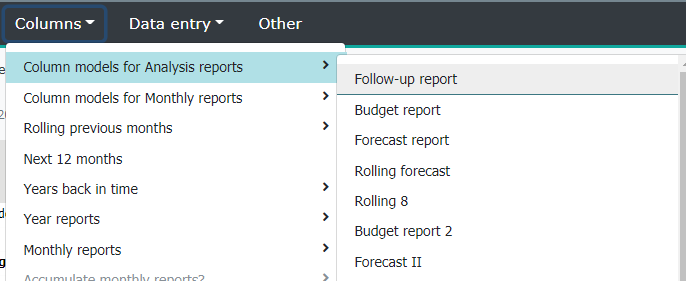
The default column models for the Analysis reports
Follow-up: Follow-up columns
Forecast: Forecast columns
Budget: Budget columns
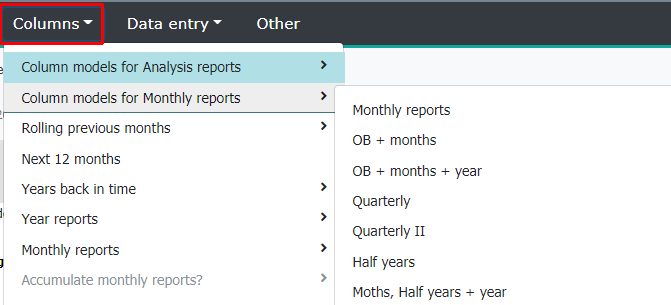
Column models for the monthly reports
Chosen column model for monthly report, defines how the columns of the chosen time period (actual, forecast, budget) is shown. For example, model consists of months, quarters, half years, and so on.
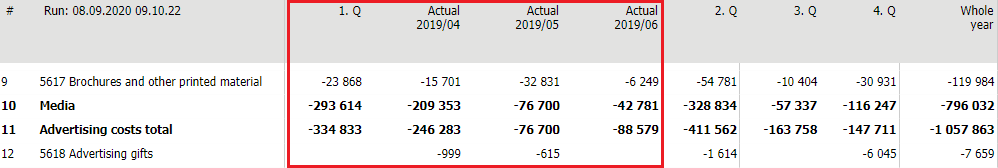
In essence, the reporting level is always at monthly level. This enables that accumulated columns, e.g. year or quarter, can be opened. To open / close column, right click the column header. Choose Open. In the example, monthly columns comprises of quarters. The first quarter is opened.
Monthly reports and their versions
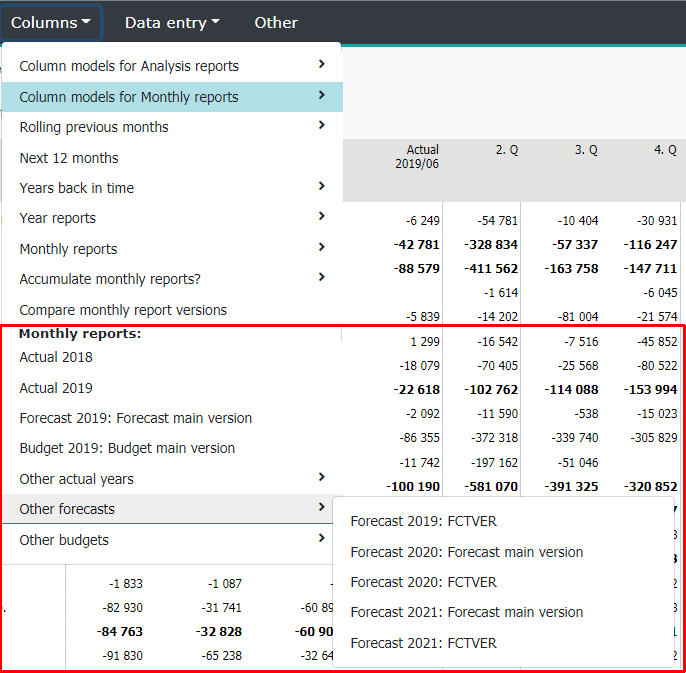
At the end of the Columns -menu, there is a list of time periods and their versions, if any. The list contains, as default, current and previous year’s actual data, the forecast main version, and the main versions of the current and budget year’s budget. Other time periods’ versions, which are in use, are located at the end of the Columns -menu. See the example.
If needed, the monthly report’s columns can be accumulated. Accumulation is explained in more detail below: Accumulate monthly versions.
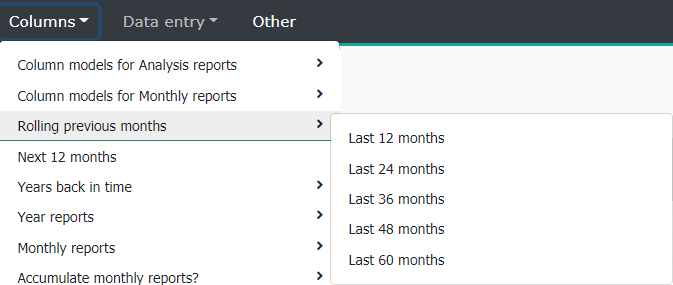
Rolling previous months
Choose the number of years shown backwards. As a function for actual forecast and budget.
Example:
Note
The function can not be selected if the monthly report is accumulated.
If rolling previous monhts is selected, the entry button is disabled
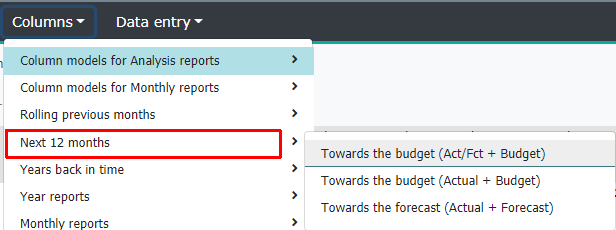
Columns for the next 12 months
Starting from the current month, remaining months displayed are either towards forecast or budget for the next 12 months.
Chosen option |
Definition |
|---|---|
Towards the budget (Act / Fct + Budget) |
Last actual month and the remaining forecast months followed by budget months for the next 12 months |
Towards the budget (Actual +Budget) |
Last actual month and the remaining budget months for the next 12 months. |
Towards the forecast (Actual + Forecast) |
Last actual month and the remaining forecast months for the next 12 months. |
Note
Column model does not allow monthly reports’ accumulation.
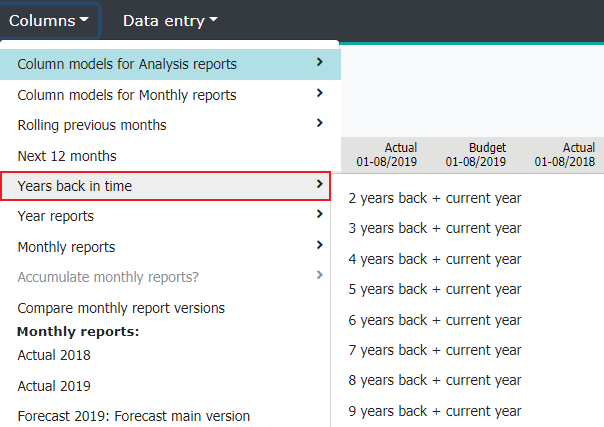
Years back in time
Yearly reports
Monhtly reports
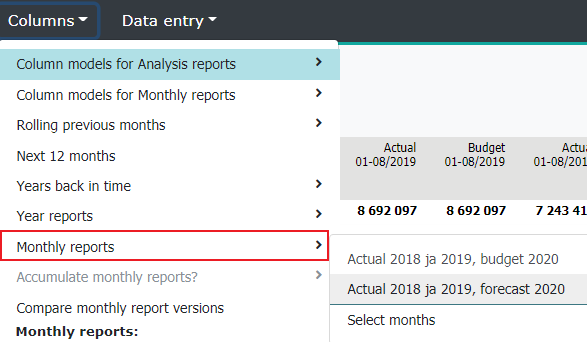
Choose months
In addition to ready made monthly column reports, use Select months to pick up desired months freely.
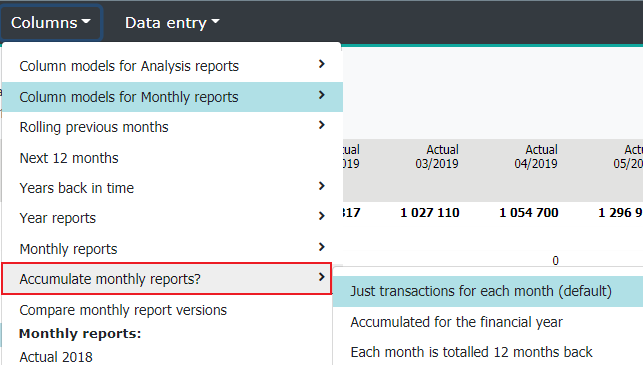
Accumulation of the monthly reports
As a default, transactions for each month is displayed. To accumulate monhtly report choose: Columns > Accumulate monthly reports > Accumulated for the financial year.
Chosen option |
Definition |
|---|---|
Just transactions for each month (default) |
Only monthly changes are shown in the monthly reports |
Accumulated from the beginning of the financial year |
Monthly reports are displayed accumulated |
Each month is totalled 12 months backwards |
Each month’s data is summed 12 months backwards. |
Note
Accumulation is in force for all monthly reports until changed. Accumulation prevents some actions, for example, the entry is closed. To cancel accumulation, select Just transactions for each month.
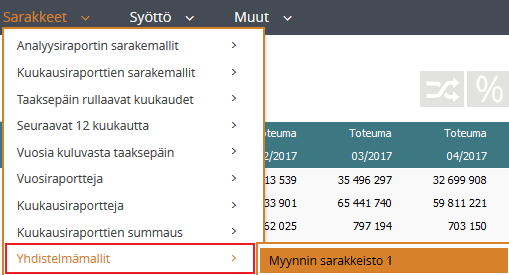
Combination models
Combination models are special column models, with combined account / time periods, defined by the System Admin. The selection is not shown, if there are no reports defined.
Choose Columns > Combination reports
Compare monthly report versions
Compare monthly report versions. Columns displayed in the report, will be the currently selected monhtly column model. If necessary, change the model: Columns | Column models for monthly columns | “Column model”
Choose Columns | Compare monthly report versions
A window with two frames will open. In the left frame (source) are all monthly reports (time periods), which can be selected into comparison. The right frame (target) contains versions selected to the comparison from the left frame.
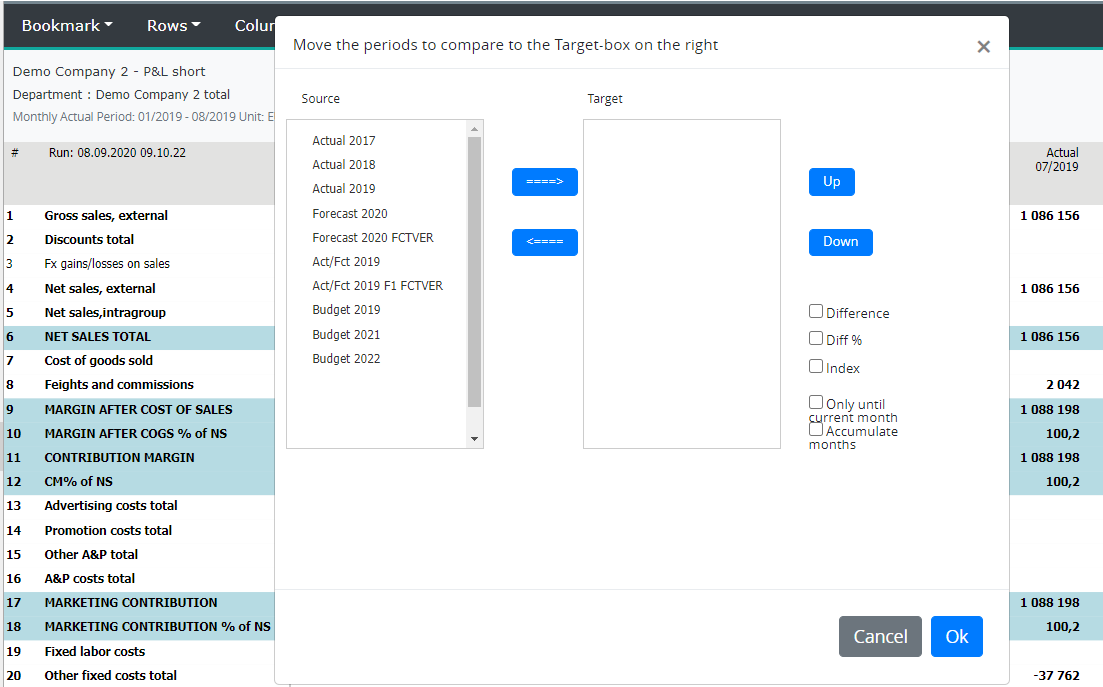
Comparison selection
To select versions into comparison, mark a version by clicking it once in the Source frame (period’s color changes). Next move it to the Target frame by pressing arrow pointing right. Please notice, the first version in the Target frame, is the period into which other selected versions are being compared to. In the same way, move all needed periods to the Target frame.
To change a version’s place in the Target frame, click it once, and move its place by pressing Up/Down.
To remove a version from the comparison (Target), click it once and press the arrow pointing left.
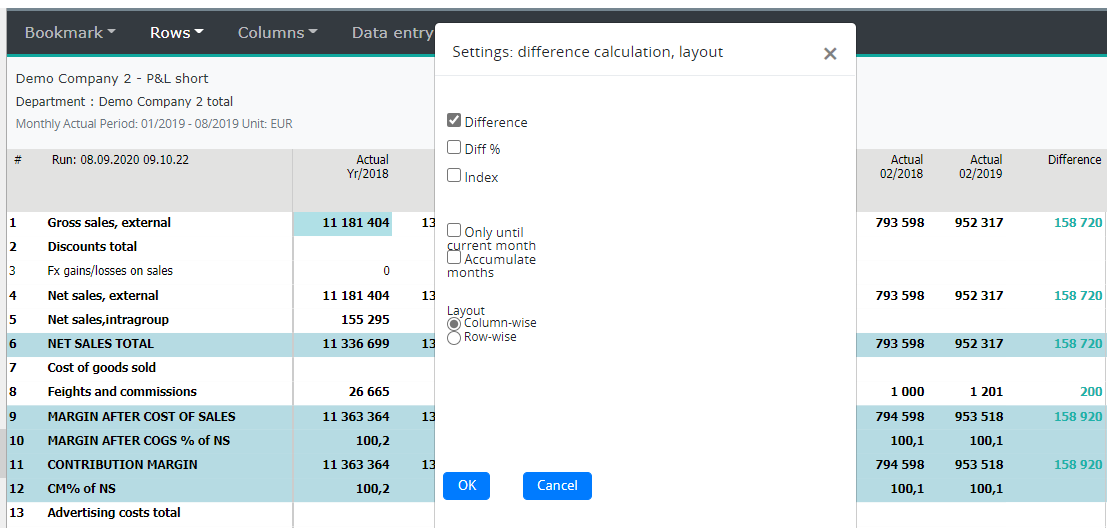
Choose how the differencies are being calculated, even all options at the same time. If needed, no selection is compulsory.
Difference |
The difference between versions is calculated. The comparison is made to the first version in the Target frame. For example, if you have selected three versions (columns) then the report shows difference between first and second version. The next comparison is made between the first and third version. Please notice, that comparison report does not show the first version column beside it, although the difference is being calculated accordingly. |
Percentage |
The difference of column comparison in percentages |
Index |
Version column/ comparison column * 100 |
Only until current month |
Comparison is made until current month only. |
Accumulate months |
Mark, if months are to be accumulated |
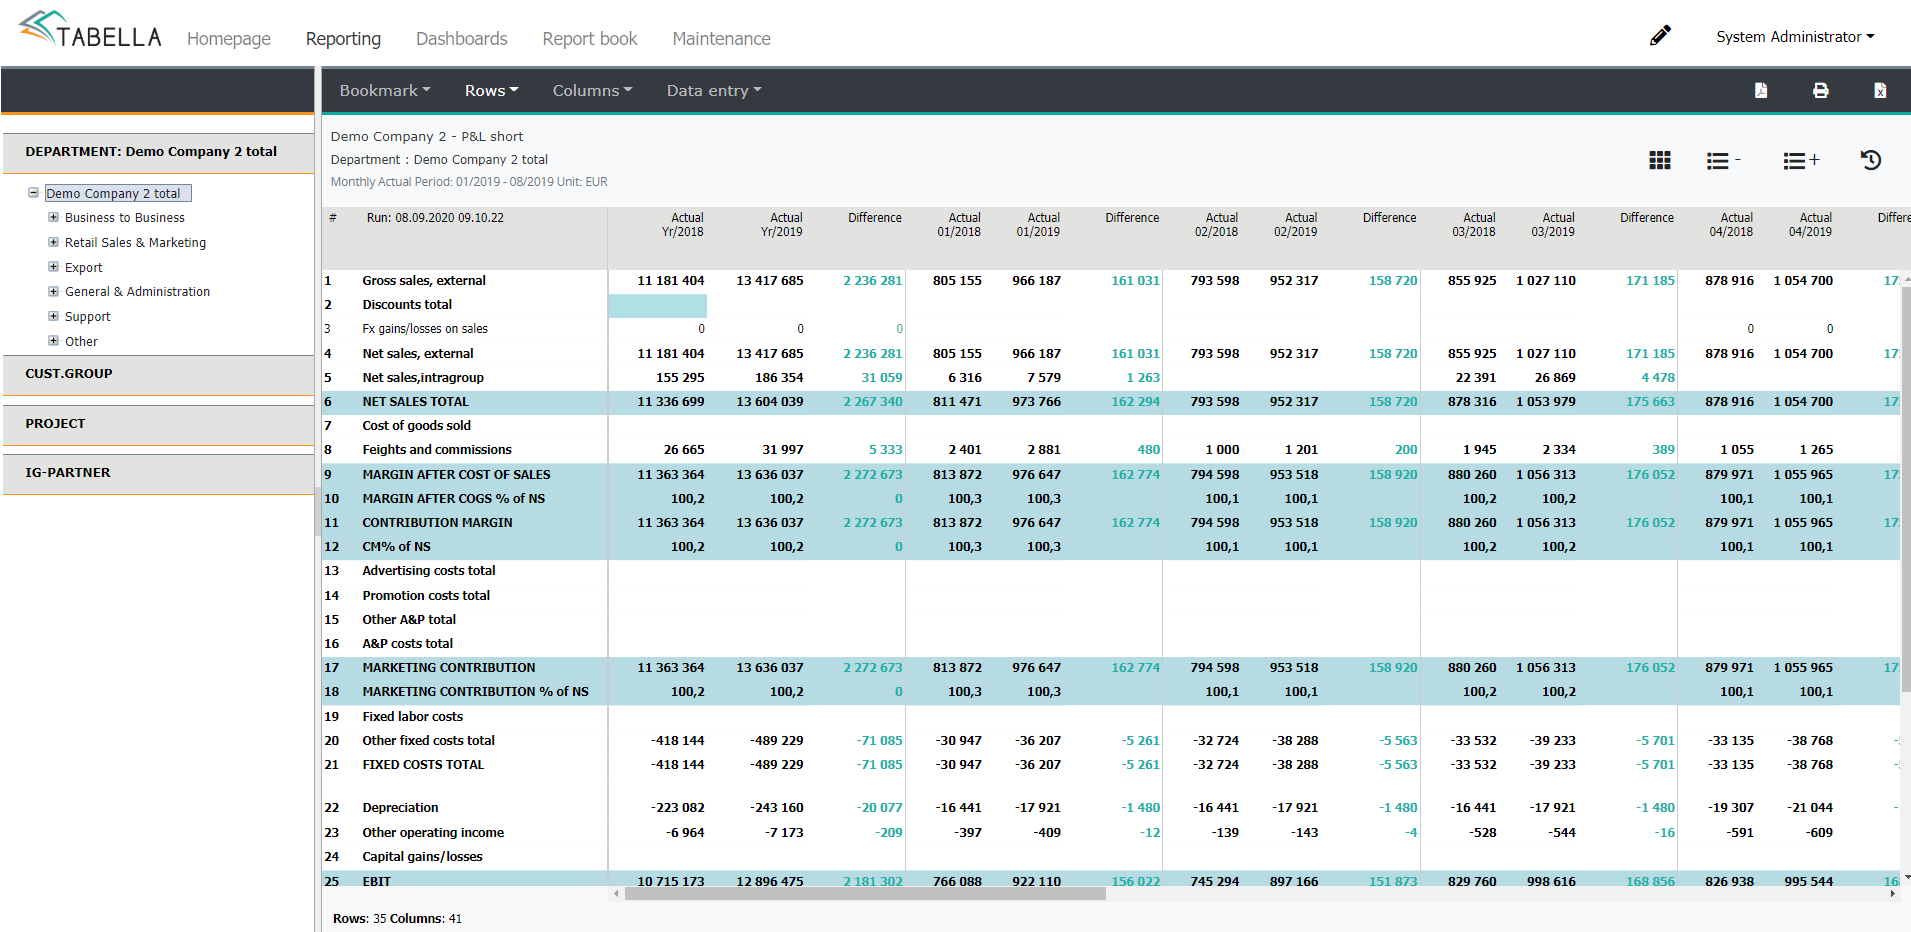
After the selections. Press OK. The comparison report will open. The first column is the column from the Target frame’s first column, followed by the same period’s data from the Target’s second column and so on
In the example below, two periods have been selected: Actual 2018 / 2019 and their difference.
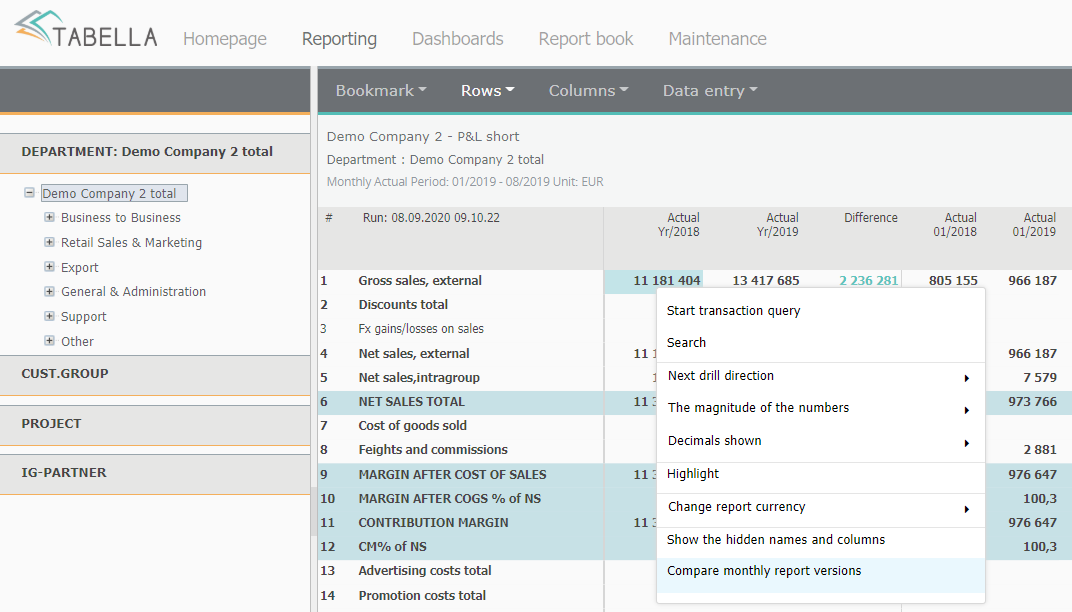
If needed, change the current calculation rules used in the comparison report. Right click the report, and choose Compare monthly report versions.
When comparison report is open, some of features are not active. However, it is possible to change organizational structure, which stays open during comparison. Additionally, you can select either short or long – report by pressing respective button, and change report model -Report -button.
To change periods selected to comparison. Restore the report, by hitting the -button and make selections again as described above.
Close the comparison report by pressing the -button.