Buttons
Reporting area’s buttons can be used to perform various functions. The functions are described next.
Temporary period change 
Use the option to browse report from different time period than current. Choose year and month. The number of available years, depends on the System Admin’s settings. Temporary period change is user specific, therefore it has no effect on other users periods
Restore original period from the same menu
Note
If the restore is not done, some functions cannot be selected, for example data entry.
Reports made by using function buttons, are described next. Return back to browsing, by selecting -button.
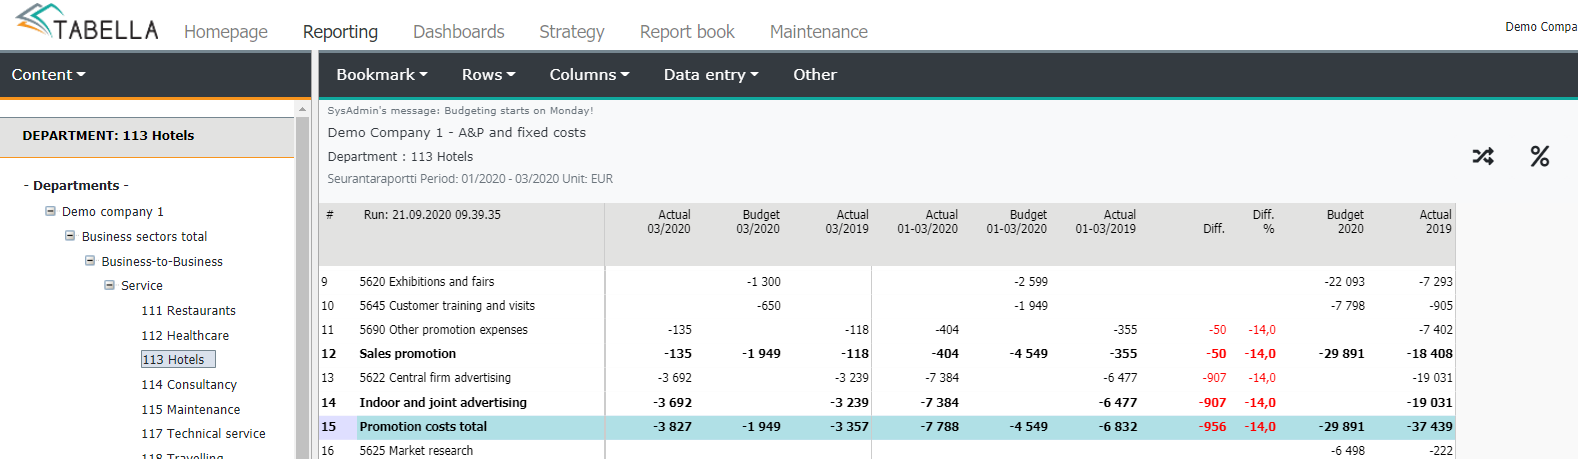
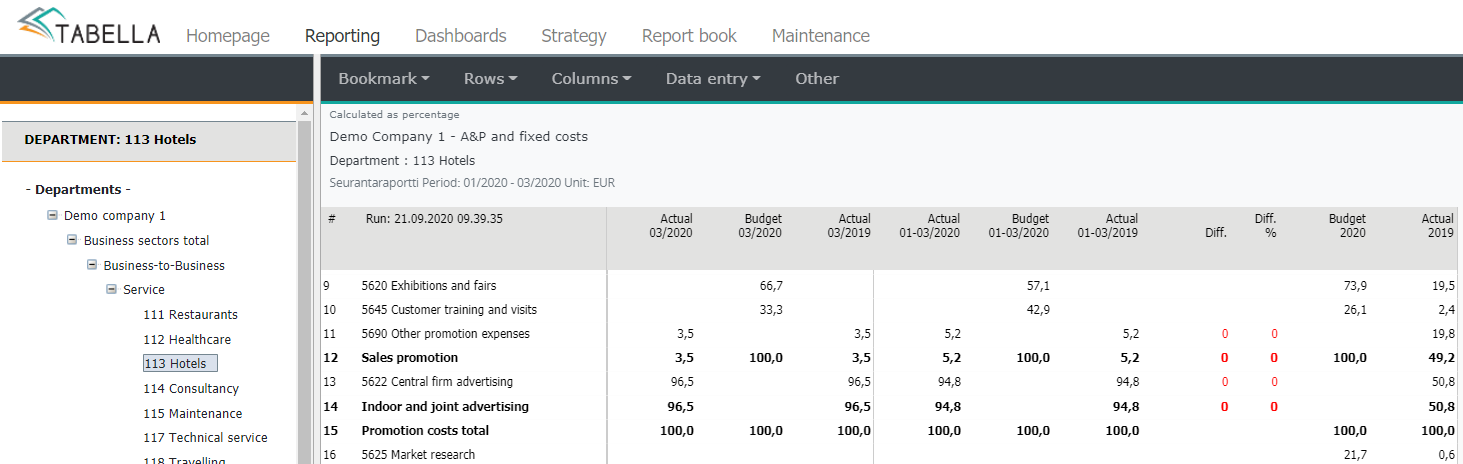
Percentage report 
Select one row or column from the report by clicking row text, or a column by pressing column header
The selected row / column is set to 100 (%), and the others are calculated in relation to selection. Press the Percentage -button. Please notice, that most buttons are deactivated, when % relationship is displayed.
Example
Row “Promotional costs” is selected by pressing its name followed by pressing the -button.
Row report 
Note
Currently selected tree structure level, affects the extent of the row and column reports.
Please notice, that depending on the selection, some functions are not selectable.
Do not create row report from so called screen calculation rows, defined by the System Admin. Rows are calculated after data is being loaded to report. This is done to ensure correct values also in accumulated reports.
Row report is a specified report of the selected row(s), to organisation’s lower levels.
Function
Select a row / rows by pressing the row text. To select several rows, press and hold the Ctrl-button while selecting rows
Press –button
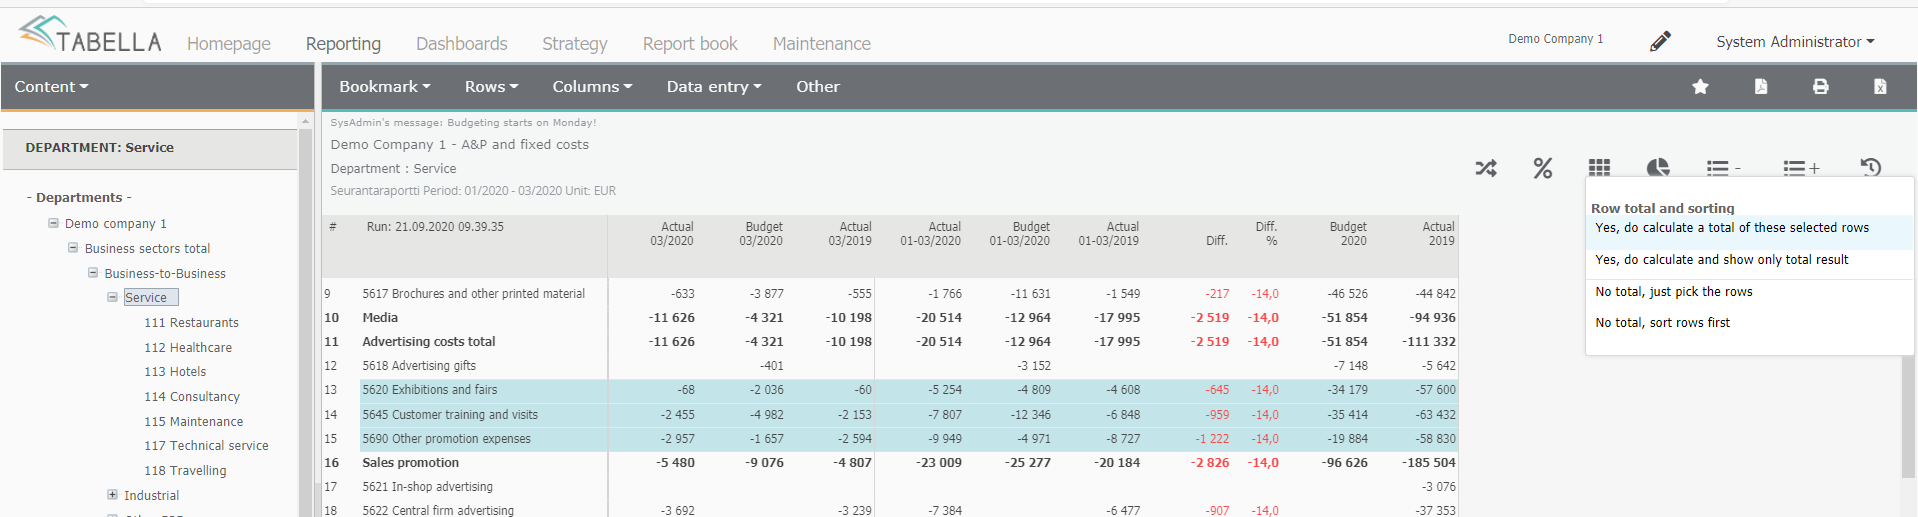
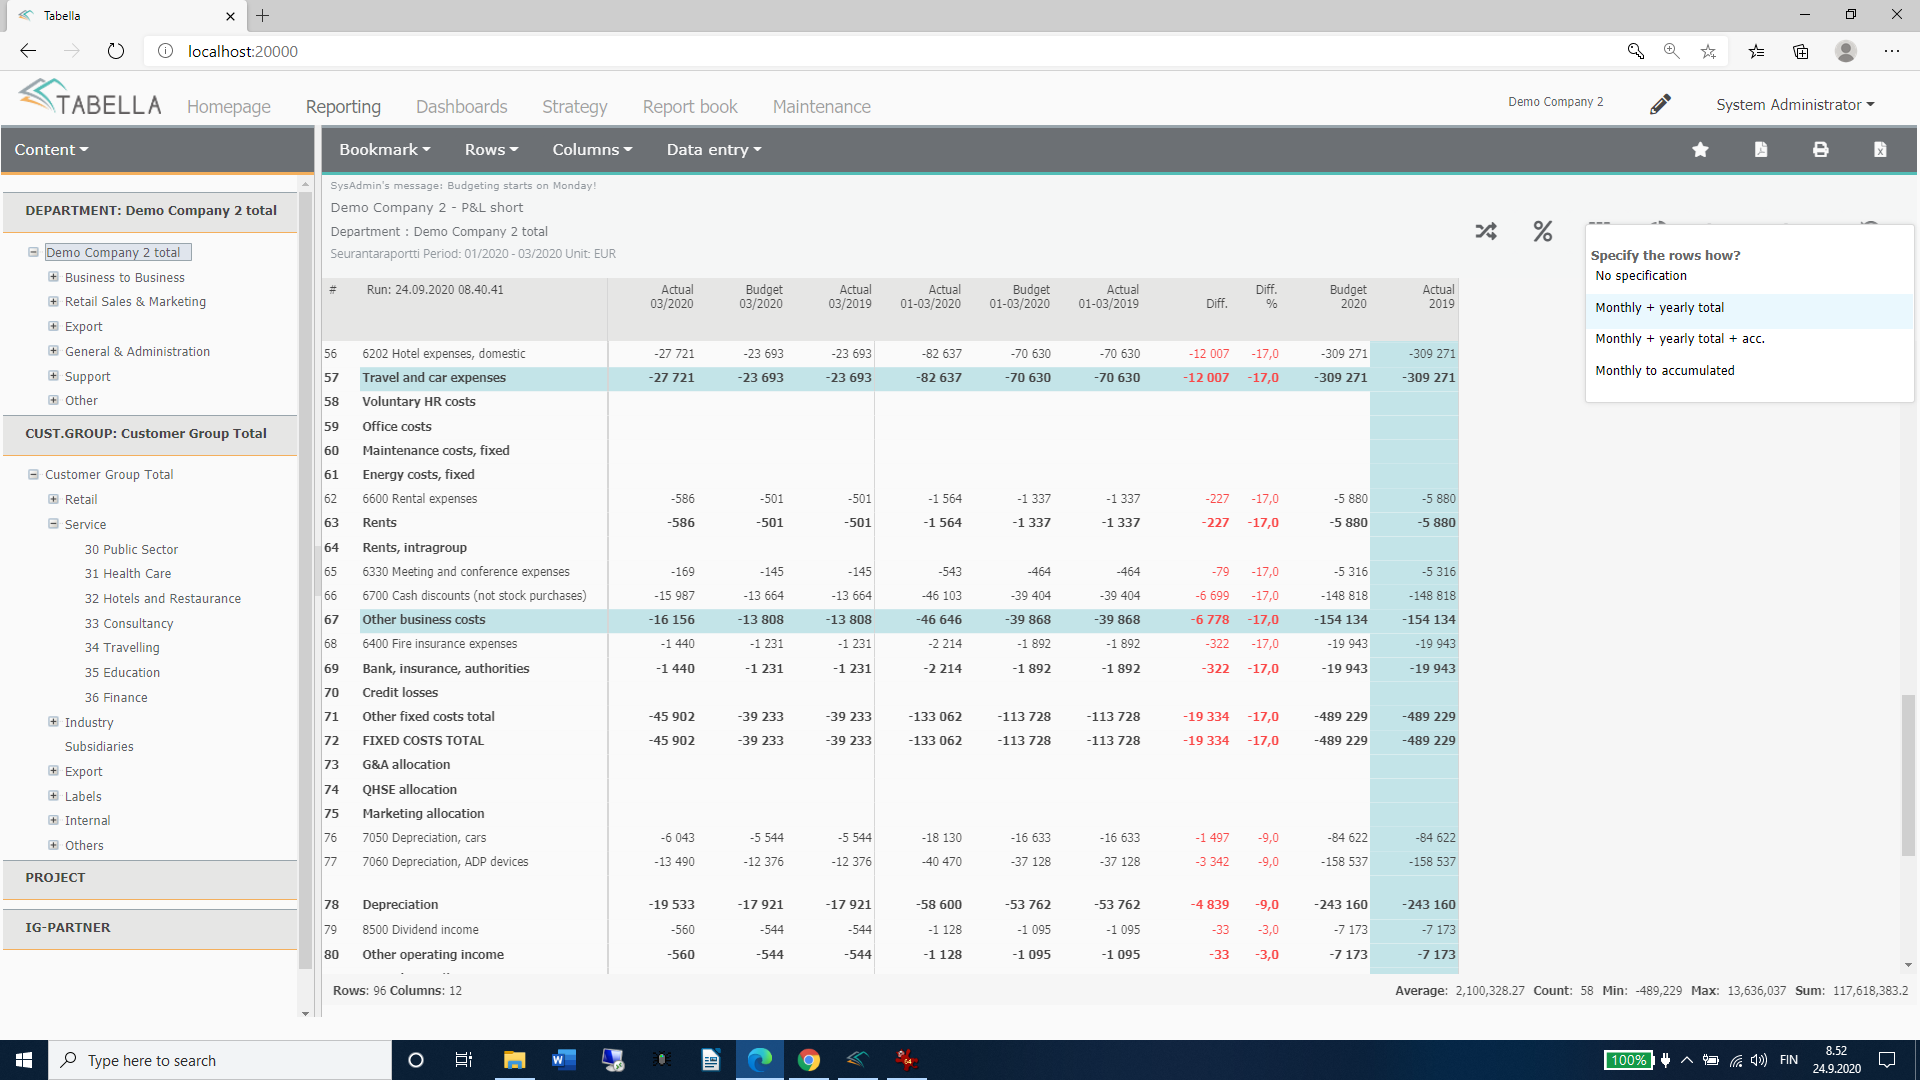
If several rows are chosen, choose how the rows’ total (row sum) is treated first.

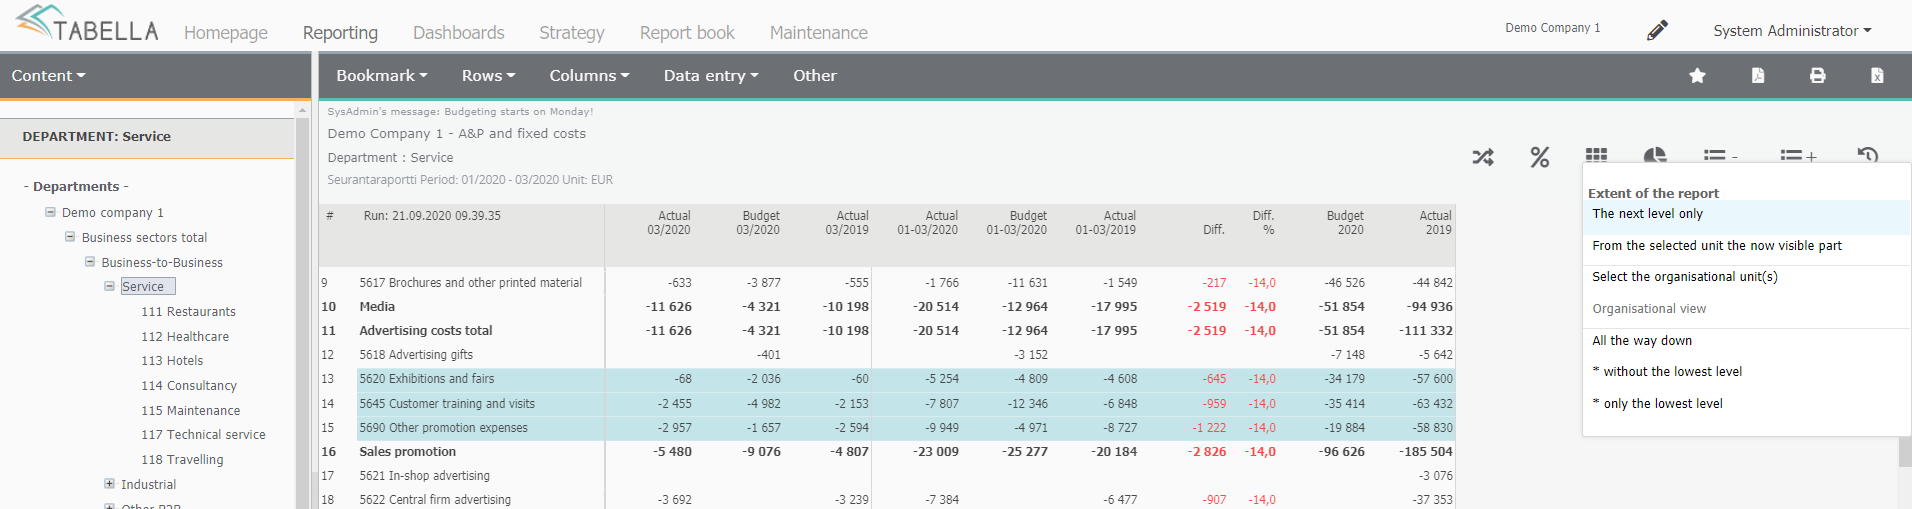
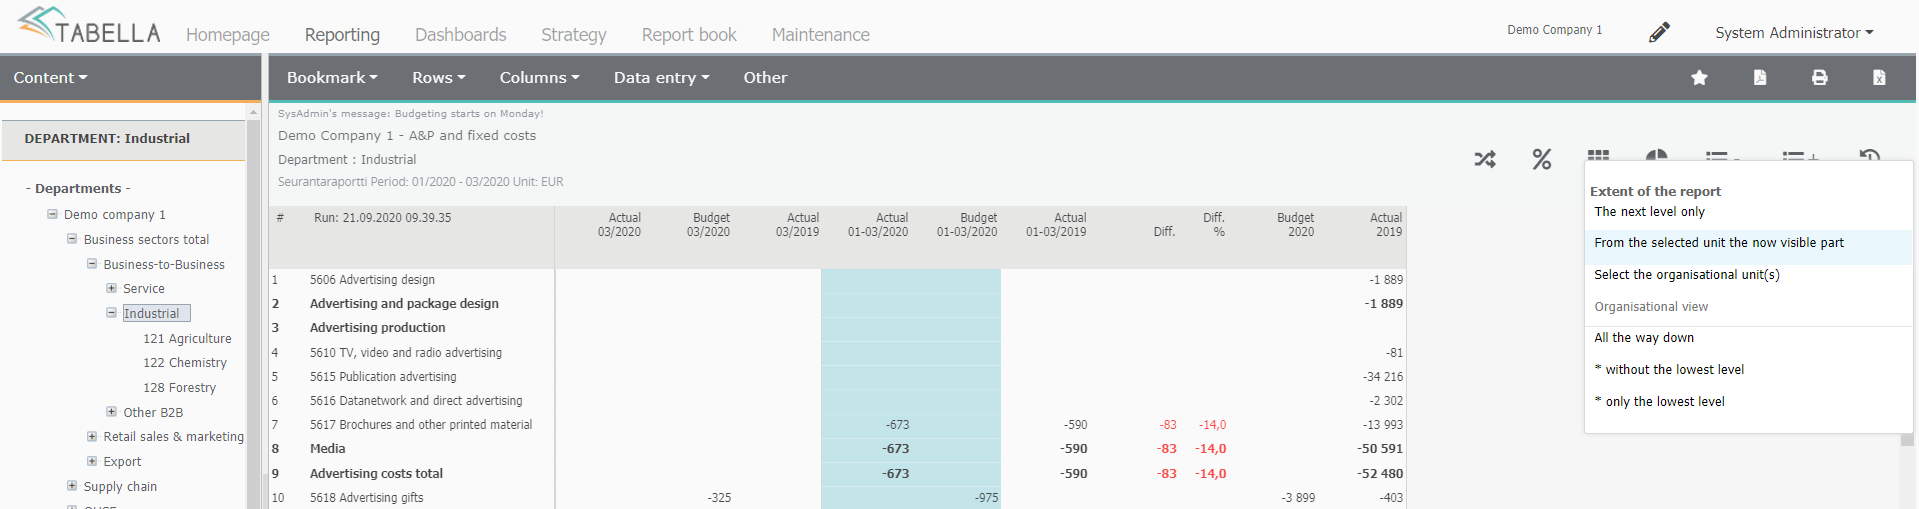
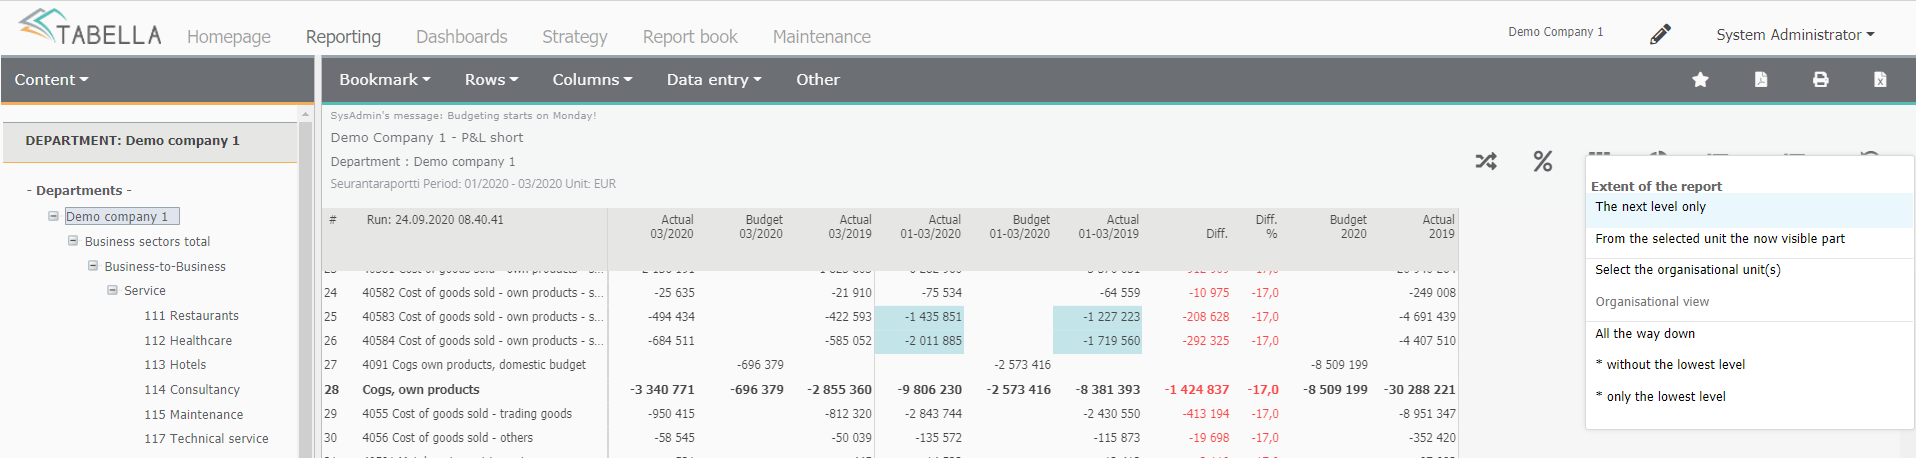
Next, choose the extent of the row report. The level refers to the level currently chosen from tree structure i.e. is visible on a tree.
The next level only |
The level of the original report and next level is shown both on row- and column report. |
From the selected unit the visible part |
all levels and cost centers visible from the selected unit downwards are show both on row and column report. |
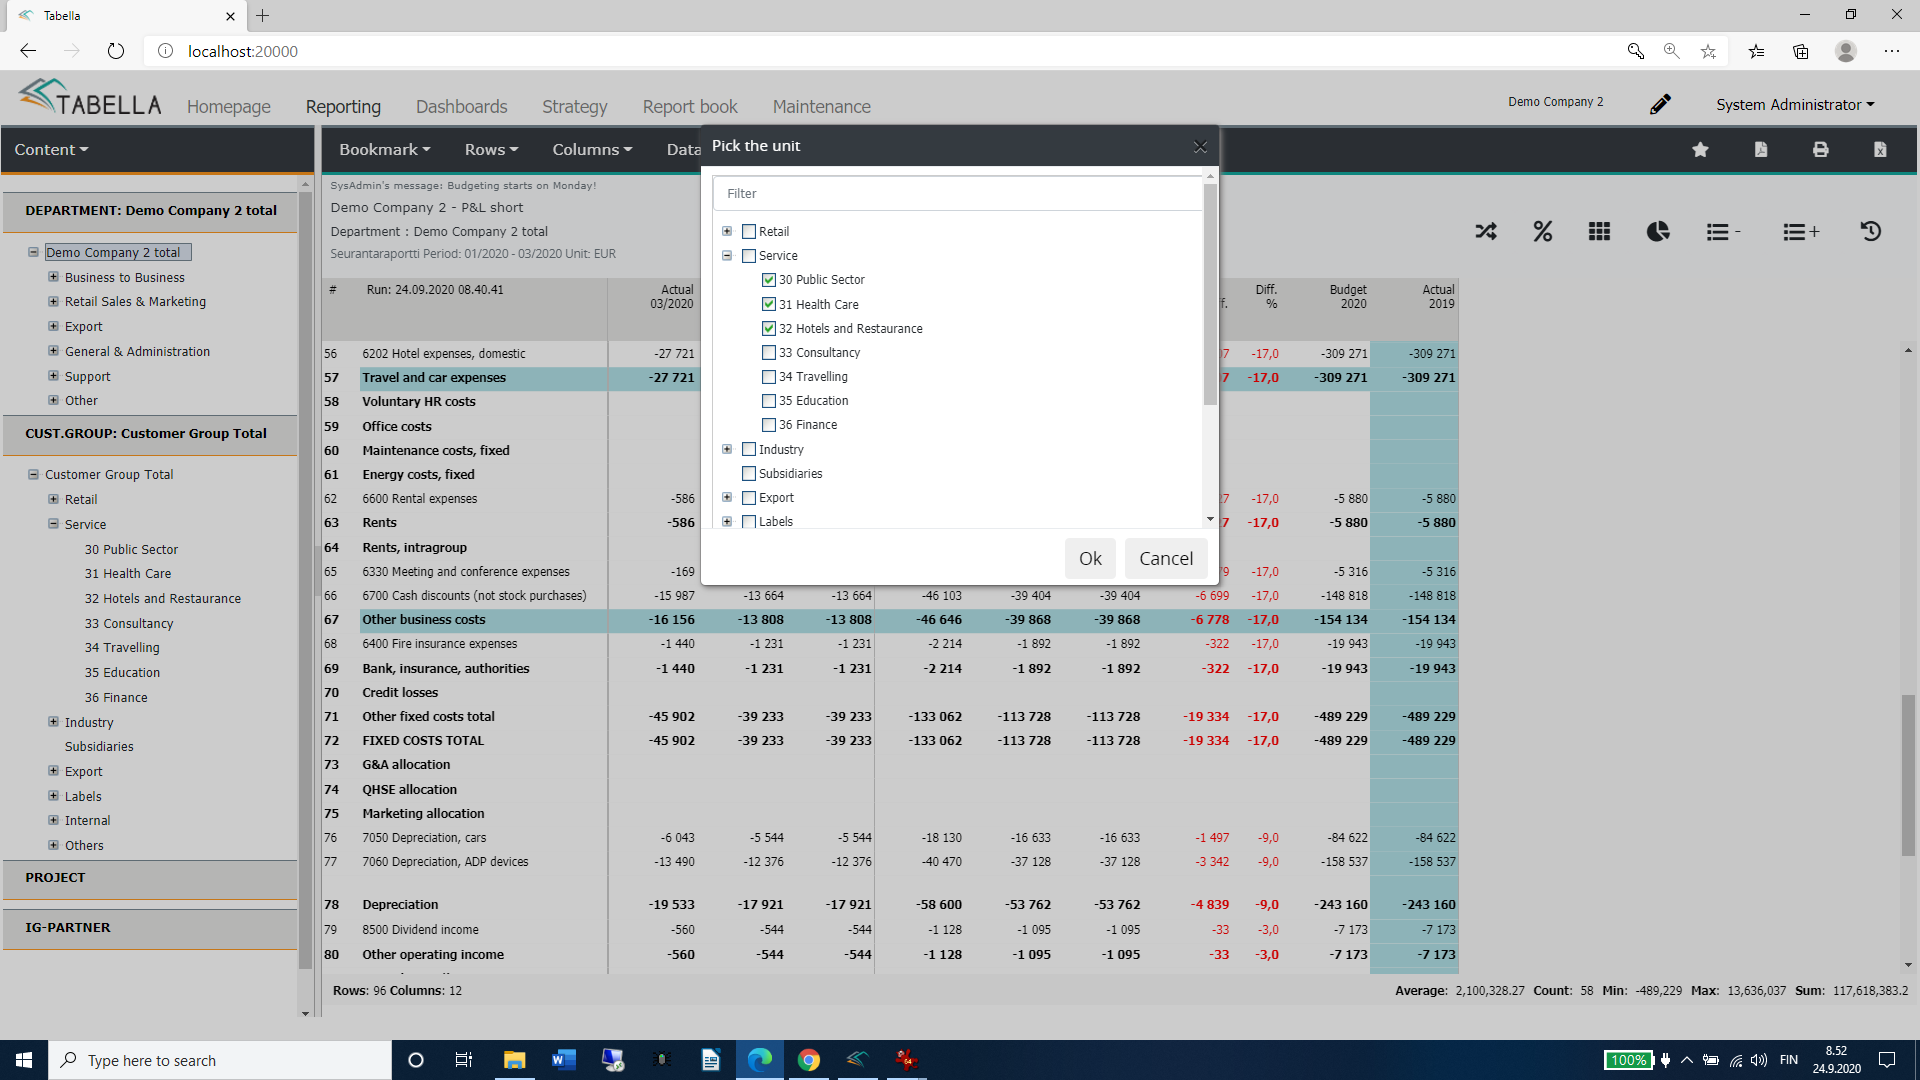
Select organizational unit(s) |
choose desired organizational unit(s) from the tree structure. After selection press Load report. |
Organizational view |
choose a view from the list. Organizational view(s) is defined by the System Admin, if any. Please notice, if a view is chosen, the currently selected tree structure level, has to include units selected to the view. If no view is defined, the selection is set to gray |
All the way down |
all levels from the selected unit downwards is shown, both on row and column report. |
Without the lowest level |
all levels, without lowest level (e.g. cost centers), from the selected unit downwards is show |
Only the lowest level |
only the lowest level, from the selected unit downwards is shown. |
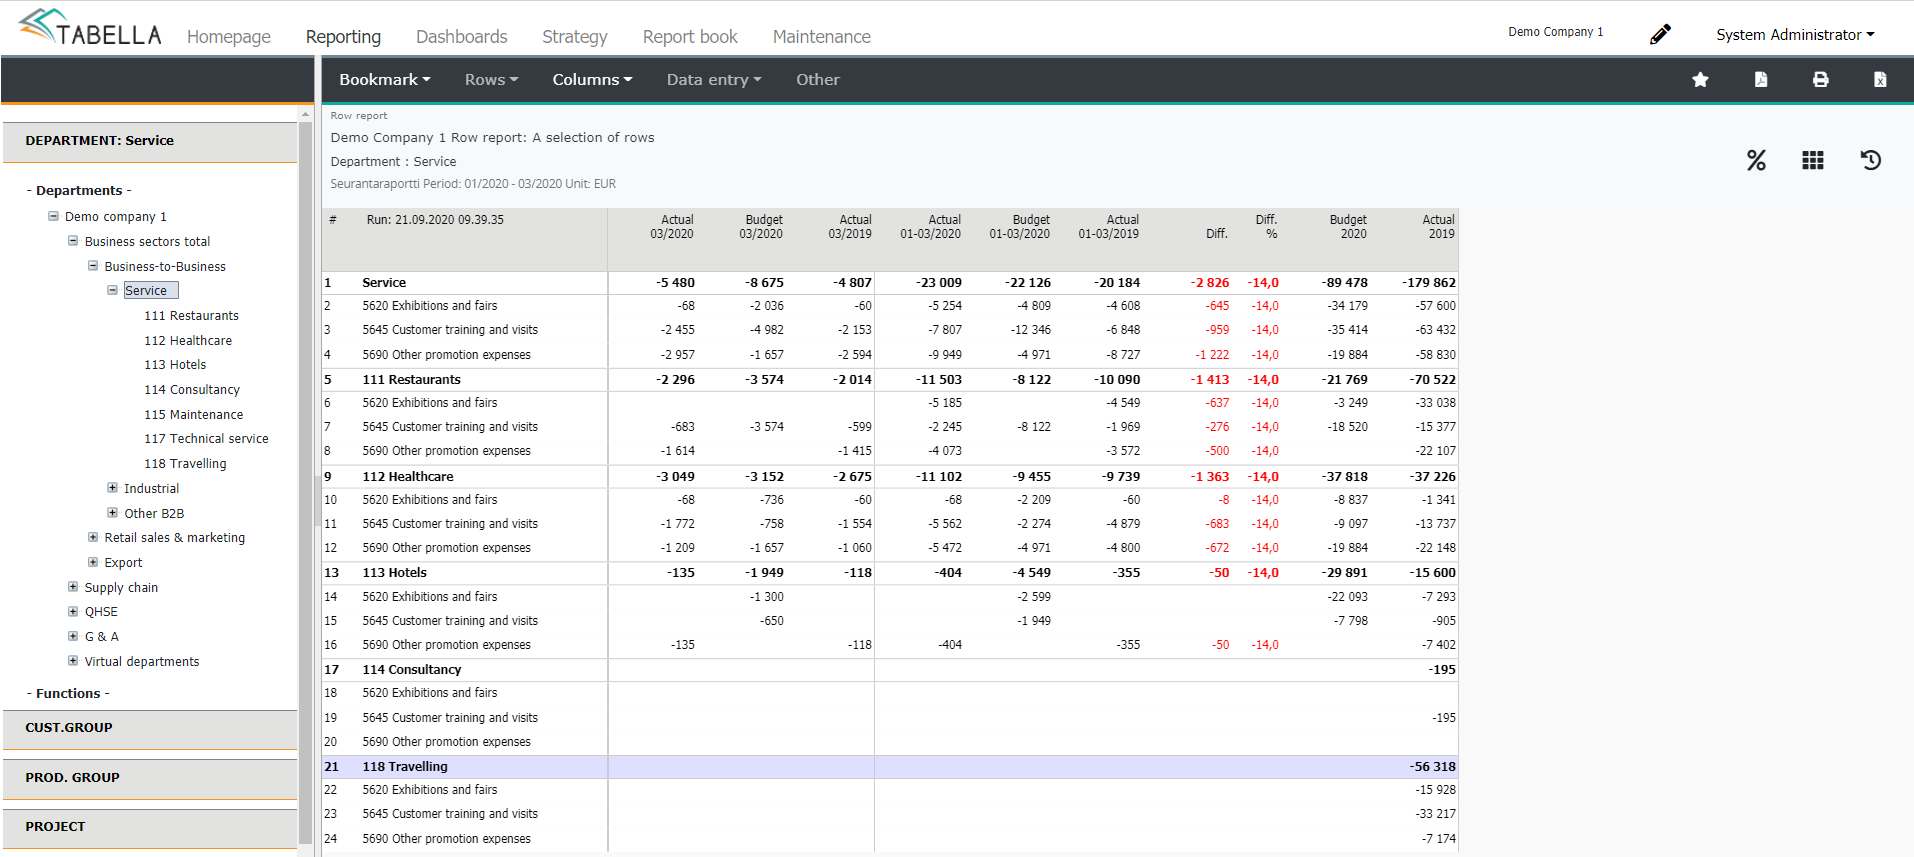
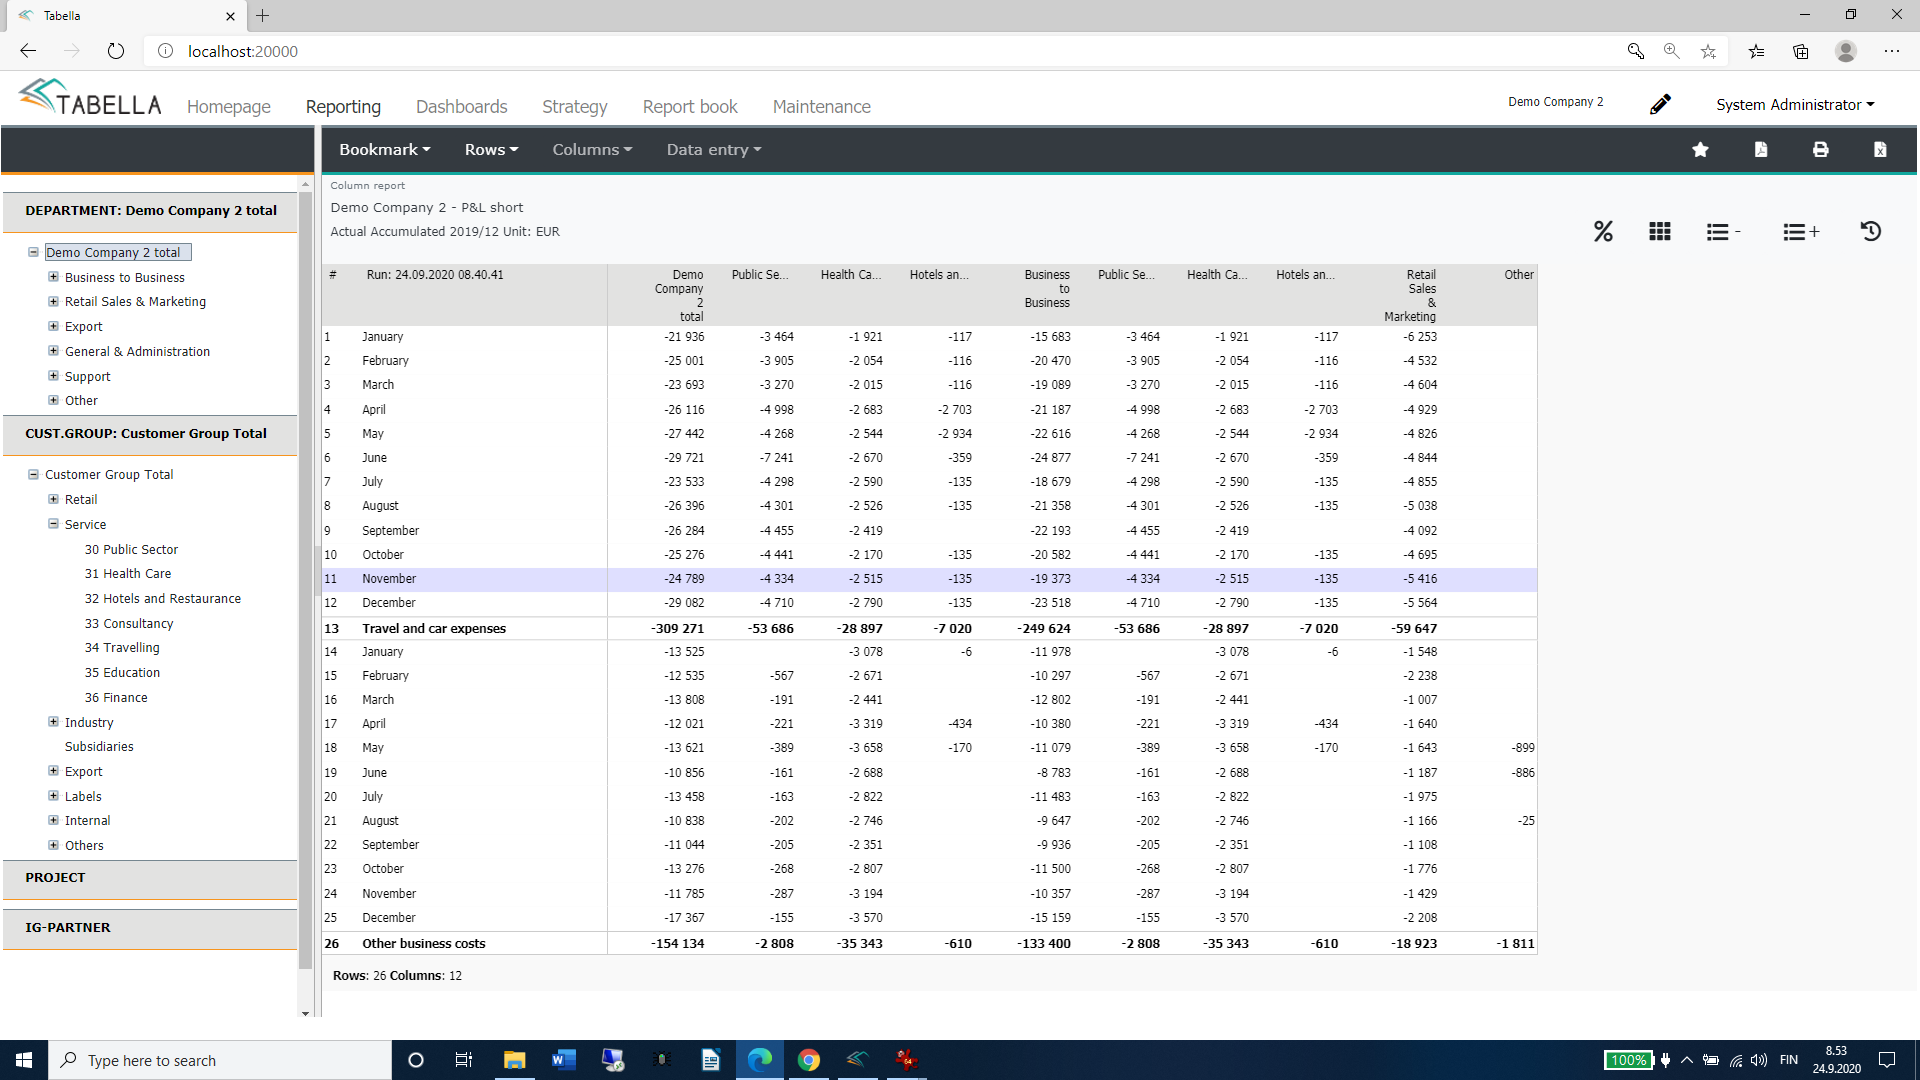
Row report example:
The Service group level is selected from the tree structure, and three rows of the report are marked. Next, after pressing the row report button, the Sum of rows is shown, is selected, followed by option Next level only. The data is fetched from the next level, which in this case is departments of the Service group level. No empty rows is shown.
Column report 
Column report is a specified report of the selected column(s), to organisation’s lower levels.
Function
Select a column / columns by pressing the upper row of the column header. To select several columns, press and hold the Ctrl-button.
Press –button
Choose the extent of the column report. The options are the same as in row report, described above.
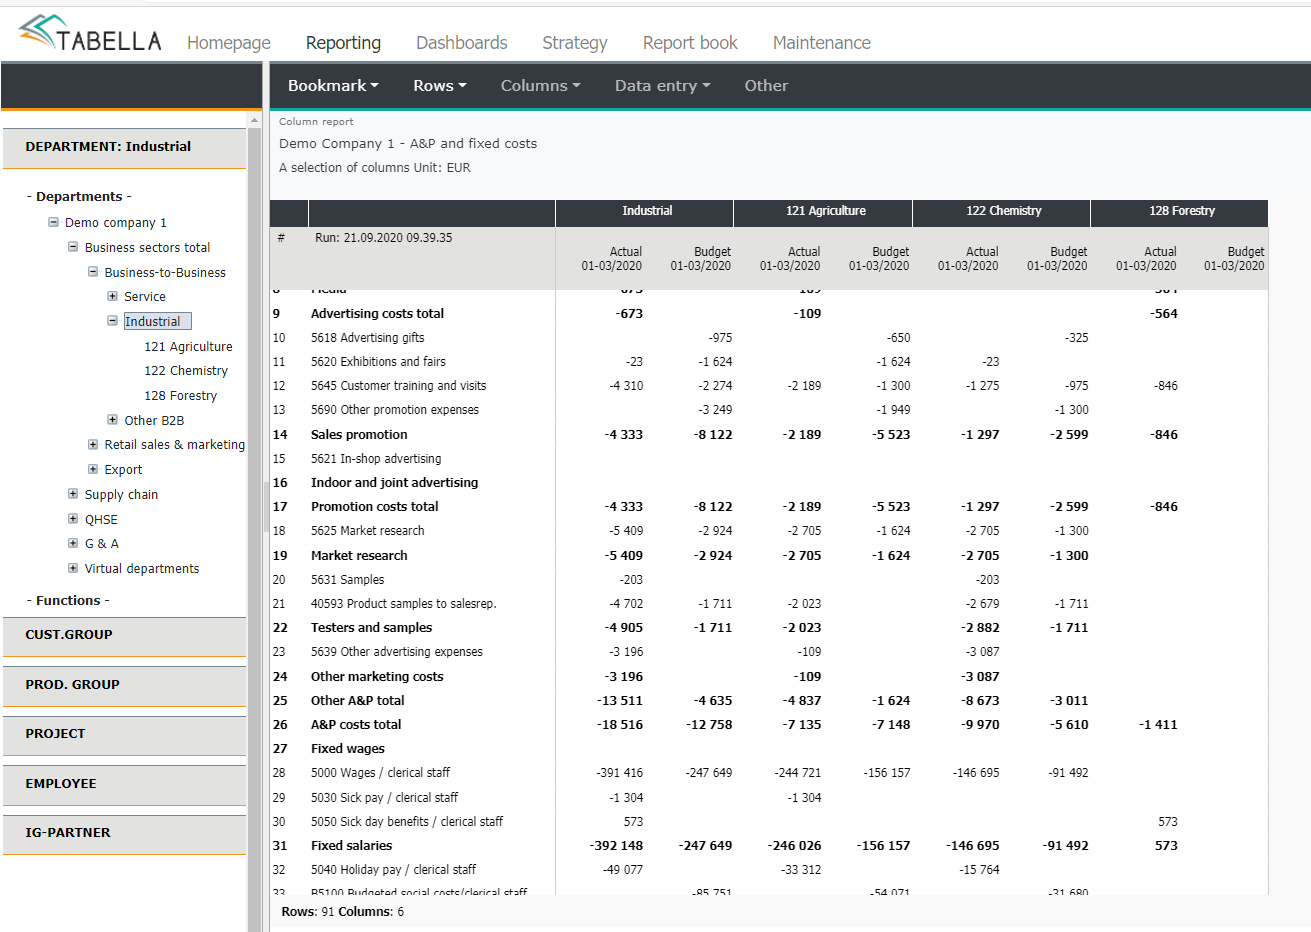
Column report example:
At the Industrial level, two columns: Actual 01-03/2020 and Budget 01-03/2020 is selected. The row model is A&P fixed costs. Option From the selected unit, now the visible part is selected. The data from the marked columns, from all group’s visible units, is shown.
Note
Tabella creates column report according to the current tree structure and settings defined.
Column report extension
Extension for column report, where the months are shown on rows.
The extension is done according to currently chosen department level (main hierarchy) level. If the selected level is other dimension, customer group, for example, the extension can not be done.
First, by pressing and holding keyboard’s Ctrl -button, choose desired row(s) and column(s). Next, define the extent of the report, in the same way as described above.
Specify how the rows are being specified.
If, in addition to main hierachy (e.g. department), other dimensions are in use, choose whether they are shown on report or not. If shown, select the time period(s) the data is fetched from. Selection opens only, if several columns are marked in the report.

In the extended column report, months are shown in rows
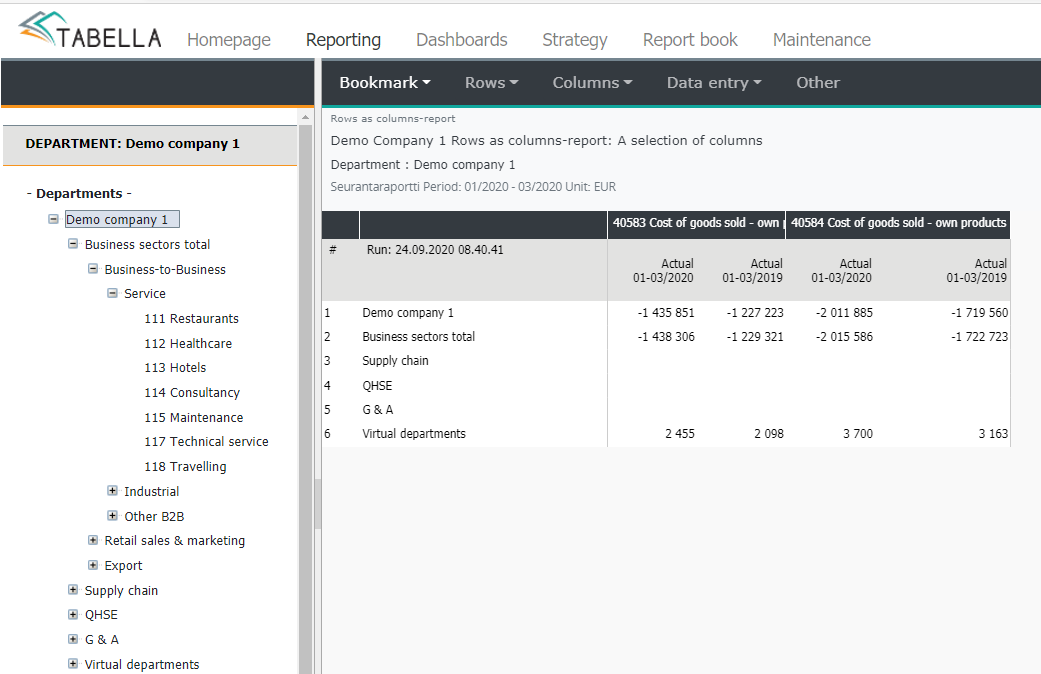
Rows as column report 
Rows as column report is a specified report of the selected column(s), to organisation’s lower levels. Reports shows organizational levels in rows, and accounts and totals row in columns.
Reversed column report is created according to tree level, which is currently selected.
Function
Mark cells from the column(s) (time period), included to the report. Press and hold keyboard’s Ctrl button, when marking cells.
Press -button
Choose the extent of the report, in the same way as in row- and column report.
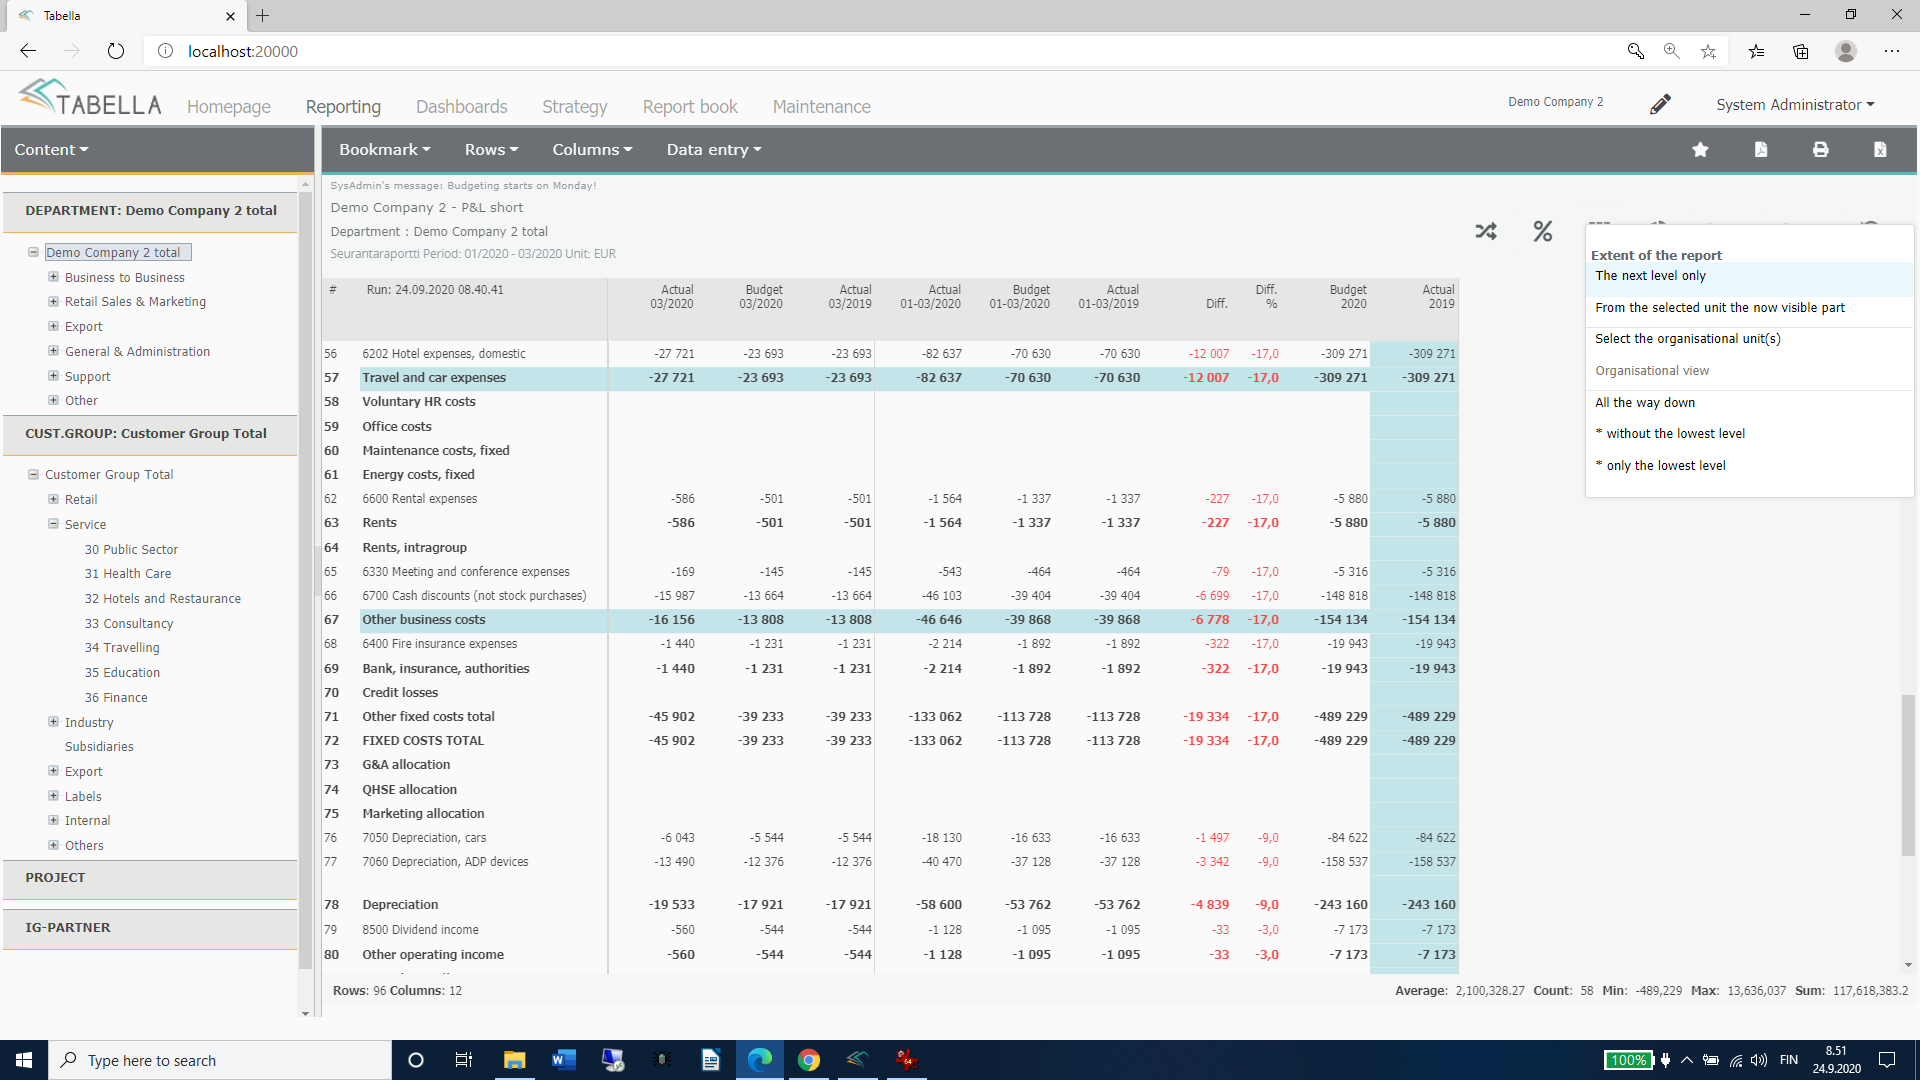
Rows as columns report example
From the tree stucure the highest level is selected. The row model is P&L Short. Two rows’ cells from two different columns is chosen. The extent is set to be: “The next level only”. The data, in addition to the selected Company level, for each group is shown.
Note
Tabella creates reversed column report, according to definitions, and the current level of the tree structure.
Row model rows’ appearance
-only accounts’ sum rows are shown in the report
“ + in addition to sum rows, also individual accounts are shown in the report.
Restore -button
To return back to the original report, press -button.