Rolling column sets
Rolling column sets -the rolling column sets are maintained in the tab.
All rolling columns sets defined, are displayed in the list, if any.
To add a new rolling column model, right click the row text, and choose for example Add below. Enter the code and name. Press OK
Note
Do not use any special characters in the code. For example, & # ? _ : space(bar)
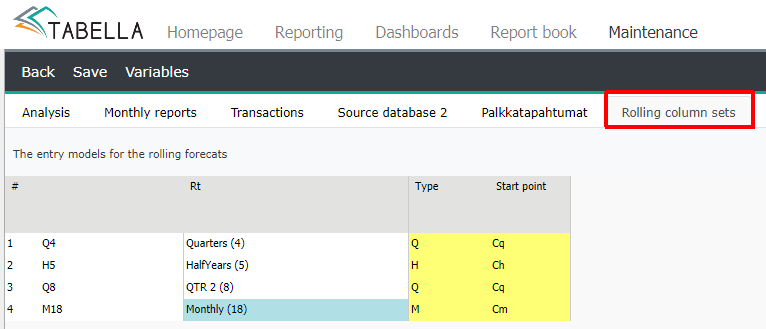
Example: Rolling coumn sets
Q = quarter / Cq = current quarter
H = half year / Ch = current half year
T = tertile / Ct = current tertile
M = month / Cm = current month
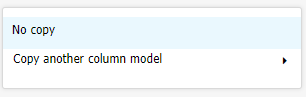
New model
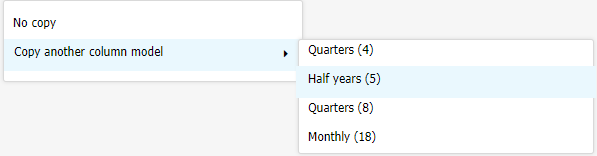
Choose No copy
Next define column models type. The type determines the lenght of the period in the rolling colum.
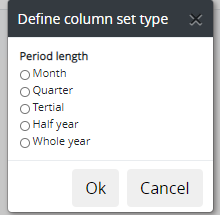
Accept by pressing OK. The base is created.
Modify periods
Right click model’s row text. Choose Modify months for this group.
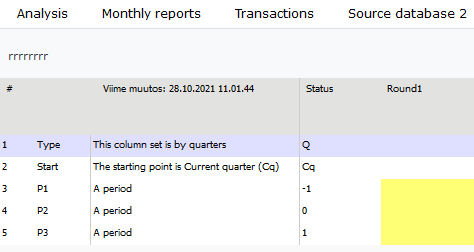
The list of the columns (periods) is empty. The first two rows; the models’ type and starting point, refer to the type selected to the model.
Add new period
Right click the starting point row’s row text. Add columns (period) to the column set. Choose Add a new column after this │ New period. The period according to the type, is added to the list.
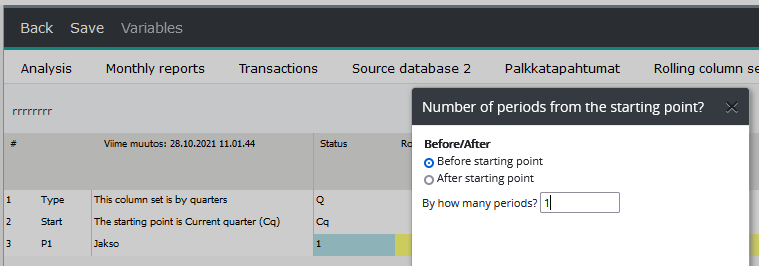
The number of periods, in relation to the starting point
In the Status column the number of periods before/after the starting point is defined.
For example, if one period (period’s lenght depends on the Type selected, e.g. quarter) before the starting point is needed to the report. Right-click in period’s Status column and choose Before Starting Point. Enter the number 1 in How many periods?
If periods before the starting point is included to the rolling columns, then the current period I.e. Period = 0, has to be included to the model.
Add new period after the first added period (= 0).
Next, add the needed periods after the Starting point (0). The value in the Status column, for each period is updated automatically.
Note
If period(s) before the starting point is included to the rolling columns, then the current period I.e. Period = 0, has to be included to the model.
Delete a column
To delete a period, right click the row text, and choose Delete this column.
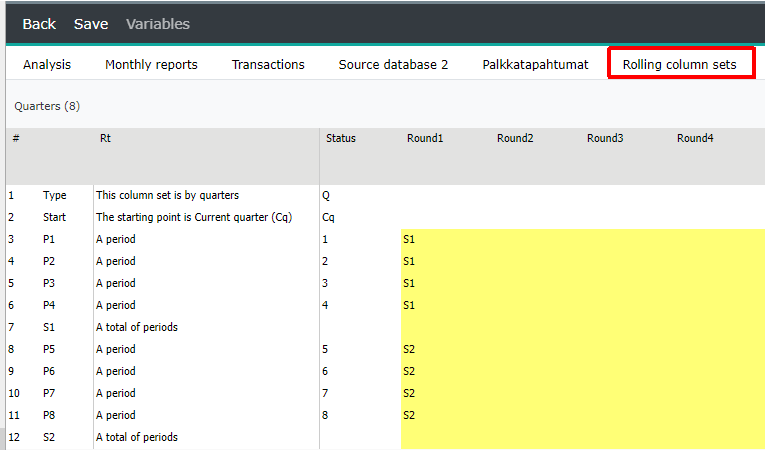
Sum column
To sum up added periods, insert a sum row(s) into the list. Choose Add a new column after this │ New total. An summary line is added to the list. The use of sum columns is optional.
To delete sum column from the list, right click its row text and choose Delete this column
Periods are added and directed to the sum column in Round steerings. Round steerings work in the same way as, for example, when defining row models in the chart of account maintenance.
In the report
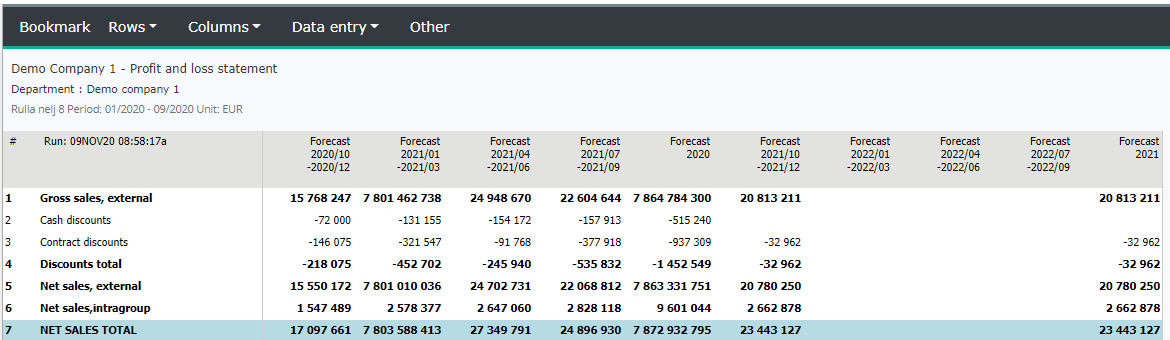
Please notice, that the current length of the forecast has to be long enough so the rolling sets fit in it.
In the example, current month/year is 09/2020. The length of the forecast is set to until next year 2021.
The rolling column model consists of eight quarters. Therefore all forecast periods do not fit to the report, thus forecast data for the year 2022 is not shown in the report.
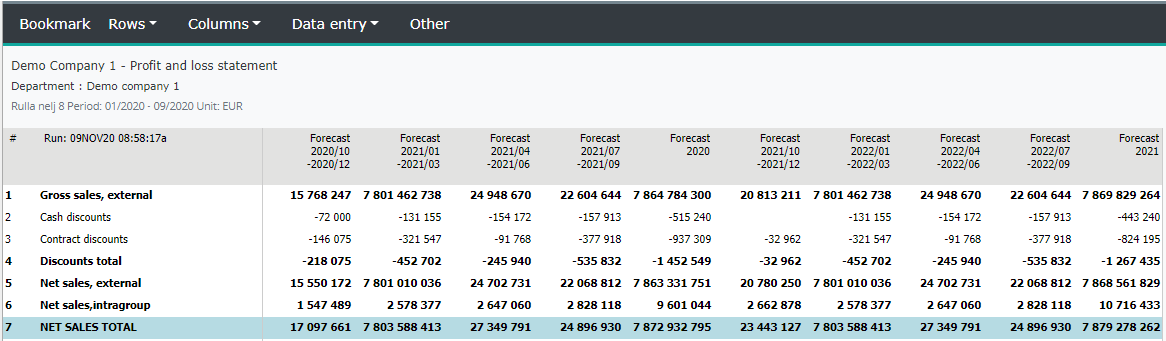
The length of the forecast has to be increased, so the rolling quarters are showed in the report also. In the example length is set to to current year + 2 (2022). See Forecast length.
When forecast length is increased, the missing data is shown in the report.
Add rolling column to column model
Move on to the Analysis tab, to create rolling column, and attach it to column model.
In column set, right click column header, and choose Add left / right │ Value column
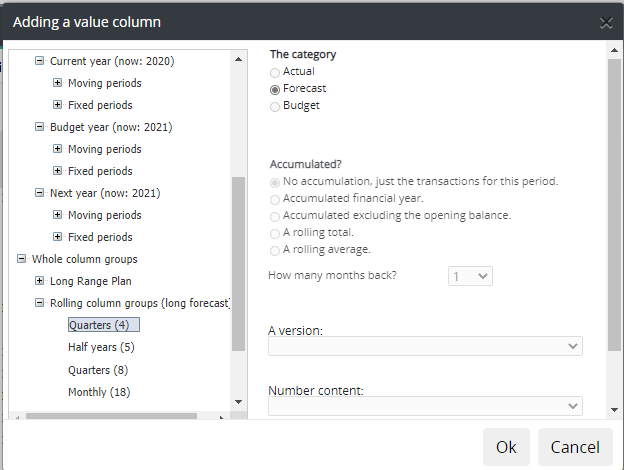
The rolling column sets, can be found from the left frame’s whole column groups. Choose the rolling column set by clicking it once. Choose Version and hit OK.
Like in any other colums, add rolling columns to existing column model, or create own model for it.
Save
After changes, press Save button – intermediate saving will not exit the maintenance. To exit maintenance, select Back | Save changes. Write a short comment about changes made.
Move on to Reporting area and choose Columns │ Column models for analysis report | “rolling column model”
Note
The length of the forecast has to be long enough so rolling column sets fit in. See Forecast length.
If the report shows no data, run the forecast reports. If no data is shown still, check that steerings are correct. For example, period 0 is defined, if the model contains periods before starting point.
Copy existing model
Add a new column model. Define the code and name. Next, choose Copy another column model. Choose the model from the list.
Modify
Right click the row text of the copied column set, and choose Modify months for this group. Modify: – add or delete periods or sum rows, and Round steerings. If needed, modify the value in period’s Status column.
Save changes
After modification, move on to Analysis tab and create new rolling column, and connect it to column model.